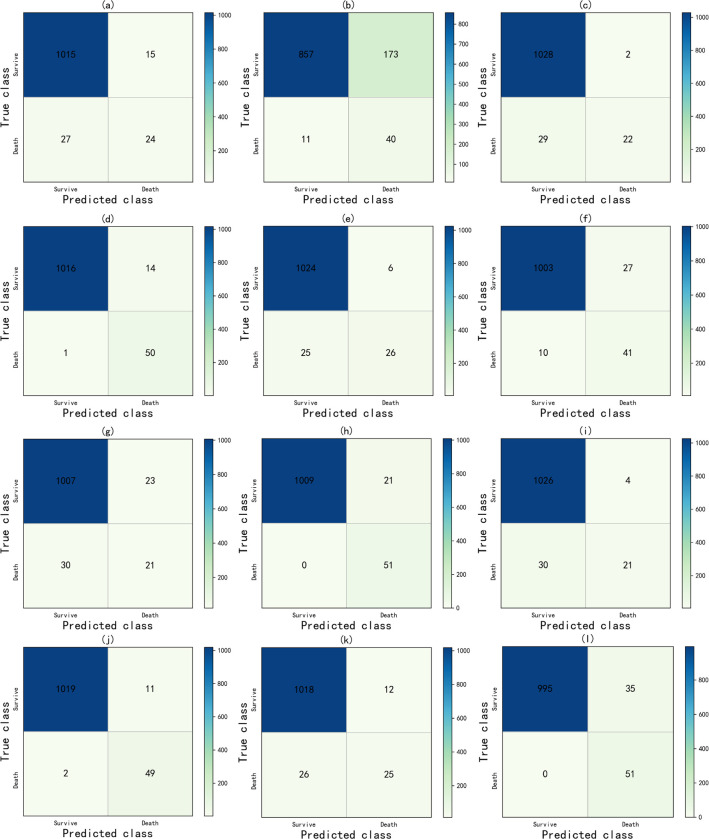
Fig 7. The confusion matrix includes.
(1) only each prediction model after data preprocessing, where (a) LR, (c) RF, (e) GB, (g) DNN, (i) XGBoost, (k) CNN; and (2) each prediction model after using feature selection and mixed sampling techniques, where (b) LR, (d) RF, (f) GB, (h) DNN, (j) XGBoost, (l) CNN.

