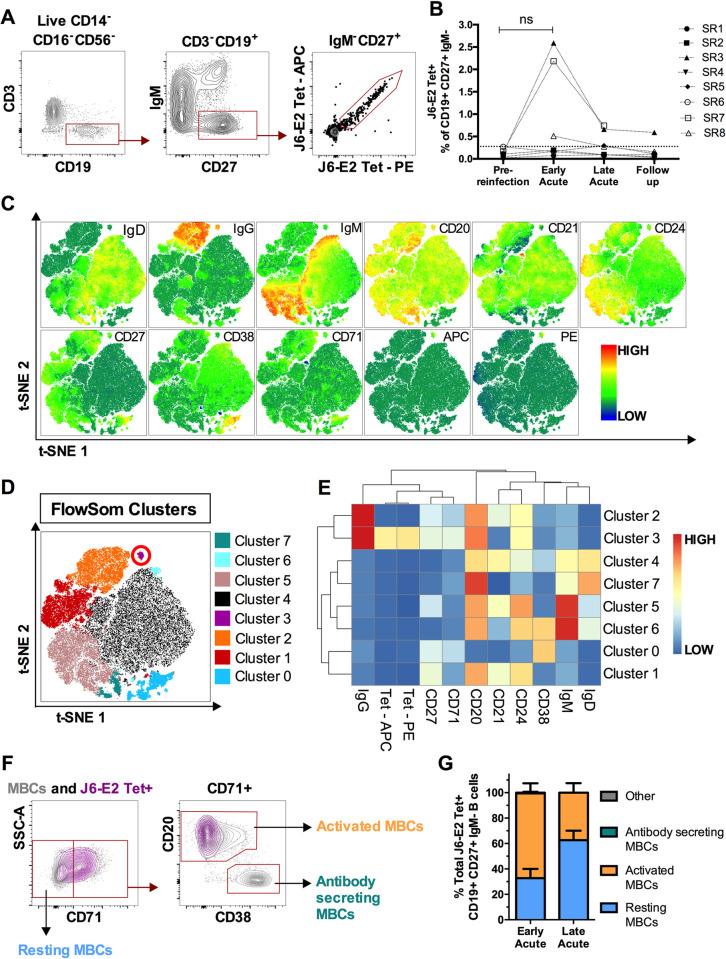
Fig 3. Activation and expansion of E2-specific MBCs following HCV reinfection.
(A) Representative gating strategy for detection of class-switched, E2-specific MBCs (CD3–CD14–CD16–CD56–CD19+CD27+IgM–E2tet+) in total PBMCs. (B) Longitudinal frequencies of E2-specific (J6-E2 Tet+) MBCs at the indicated time points (see Fig 1A). Threshold of detection of E2-specific MBCs (dotted line) was 0.277% (mean detection + 2SD from 5 naive PWID). (C) Global t-SNE projection of CD3–CD14–CD16–CD56–CD19+ B cells from three subjects (SR3, SR7 and SR8) at the Early Acute time point, concatenated and overlaid. Each t-SNE projection reflects the expression of the indicated protein marker. (D) t-SNE projection of B cell clusters identified by FlowSOM clustering. (E) Heatmap shows mean fluorescence intensities (MFI) of each protein marker (columns), for each detected FlowSOM cluster (rows). (E) Representative gating strategy of resting MBCs (CD71–), activated MBCs (CD71+CD20hiCD38int-lo), antibody-secreting MBCs (CD71+CD20loCD38hi) shown for the total MBCs population (grey contour plots), and HCV E2-specific MBCs (purple contour plots). (F) Phenotypes of E2-specific MBCs in resting (blue), activated (orange), or antibody-secreting (green) states (cells that did not meet these categories are designated as Other and shown in grey) at Early Acute and Late Acute time points (n = 3; SR3, SR7 and SR8). Significance was determined by Two-way repeated measure ANOVA with Tukey’s post hoc test (ns: not significant).

