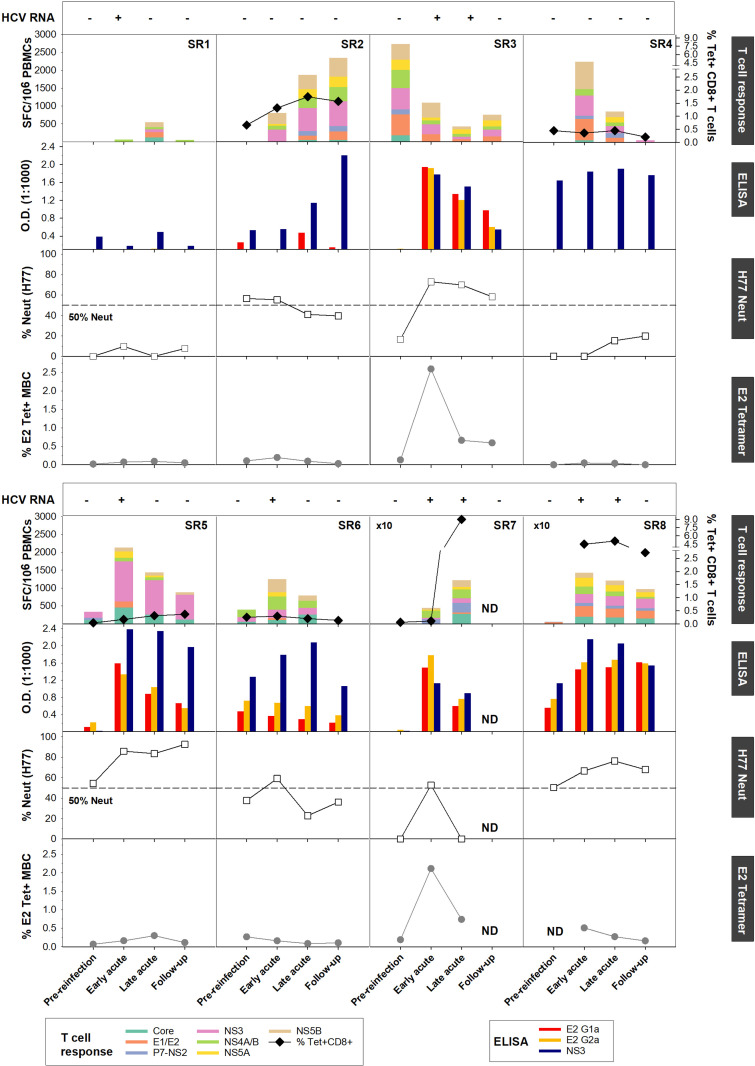
Fig 4. Concerted increase of HCV-specific T and B cell responses during acute reinfection.
Results are presented per subjects with from top to bottom: (HCV RNA) Viremia status presented as viremia positive (+) and negative (-). (Longitudinal IFN-γ ELISpot responses and MHC class I tetramer+ CD8+ T cells). PBMCs from the indicated time points were tested in an IFN-γ ELISpot assay against overlapping peptide pools representing the HCV H77 (SR2, SR3, SR5, SR6, SR7 and SR8) or J4 polyprotein (SR1 and SR4). The frequencies of IFN-γ spot forming cell (SFC) per million PBMCs from all subjects are presented in each top graph. When available, longitudinal MHC class I tetramer+ CD8+ T cells frequencies were assessed. The following tetramers were utilized: A1-1436 (SR2), A2-1073 (SR5), B7-41 (SR7 and SR8) and B27-2841 (SR4 and SR6). Subjects SR4 and SR6 ELISpot results were previously published in [6]. Pre-reinfection time-point different from the ones mentioned in Table 1 were used for subjects SR2 (-133) and SR3 (-815). (ELISA) Anti-E2 (gt1a and gt2a) and NS3 (Right) IgG responses in plasma measured by ELISA and represented as OD450–570. (H77 HCVpp) Plasma neutralizing activity against H77 HCVpp presented as percentage of neutralization relative to naïve donors. The dotted line delineates the 50% neutralization threshold. (J6-E2 Tetramer) Longitudinal J6-E2 Tetramer+ MBCs frequencies. No PBMC samples were available at pre-reinfection for subject SR8 to evaluate the frequency of J6-E2 Tetramer+ MBCs.

