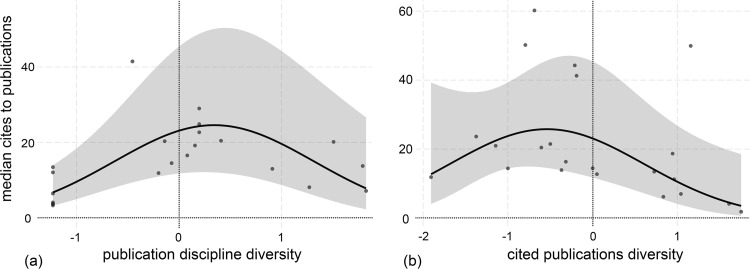
Fig 3. Influences on citations received.
The median number of citations received by a group’s publications against (a) publication discipline and (b) the diversity of publications cited. One group is an outlier to the plot in 4(a) and is not visible in the plot. The 95% confidence envelope around the trend is shown. ‘0’ on the axes is the grand mean for all groups for that variable, and the intervals shown are one standard deviation from the mean. The data points show the partial residuals for the groups, i.e., the residual after controlling for the other variables in the regression.

