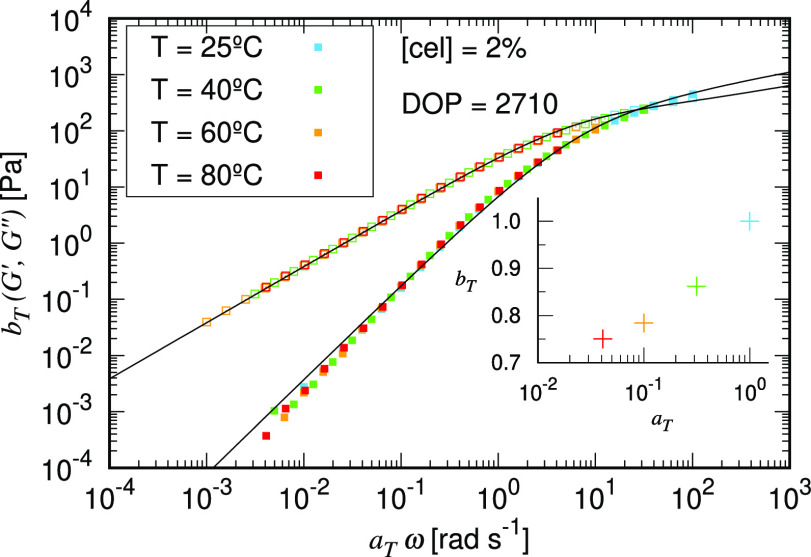
Figure 3.
SAOS master curve obtained via tTS for cotton fibers (DOP = 2710) dissolved in [C2C1Im][OAc] at 2% cellulose concentration, referenced at 25 °C, with solid symbols indicating G′ and hollow symbols indicating G″. The solid lines represent the fitting to the FML model. The shifting factors bT and aT are shown in the inset plot.

