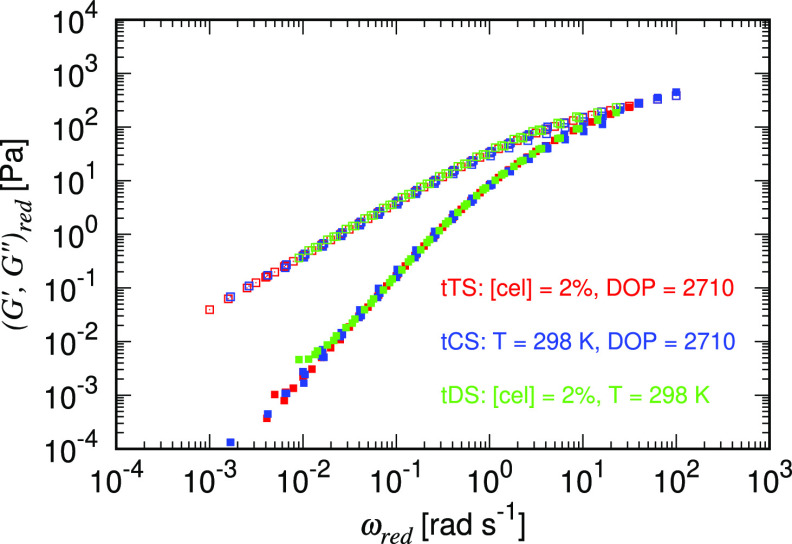
Figure 6.
Super master curve including temperature (from Figure 3), concentration (from Figure 4), and DOP superposition by the generalized shifting parameters a(T, [cel], DOP) and b(T, [cel], DOP) letting (G′,G″)red ≡ b(T,[cel],DOP)(G′,G″) and ωred ≡ a(T, [cel], DOP) ω. The solid symbols indicate G′ and hollow symbols indicate G″.

