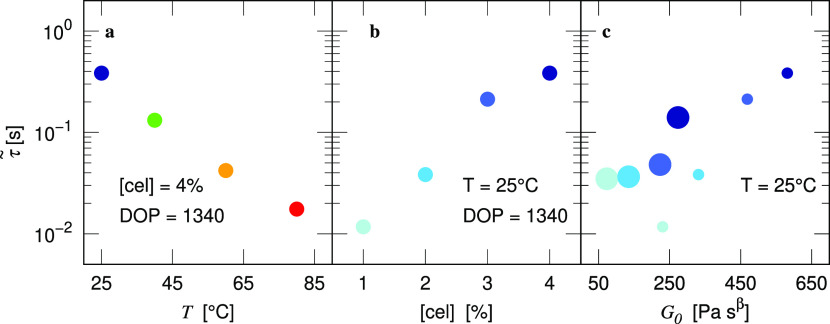
Figure 7.
Characteristic relaxation time (τ̃) against (a) temperature (visualized by different marker colors) and (b) cellulose concentration (visualized by blue markers with different luminances) obtained from fitting to the FML model. (c) We show correlation of τ̃ and G0 for DOP = 1340 with [cel] = 1.0, 2.0, 3.0, 4.0% and DOP = 2710 with [cel] = 0.5, 1.0, 1.5, 2.0% [visualized by different marker sizes for DOP and luminances as in (b)].

