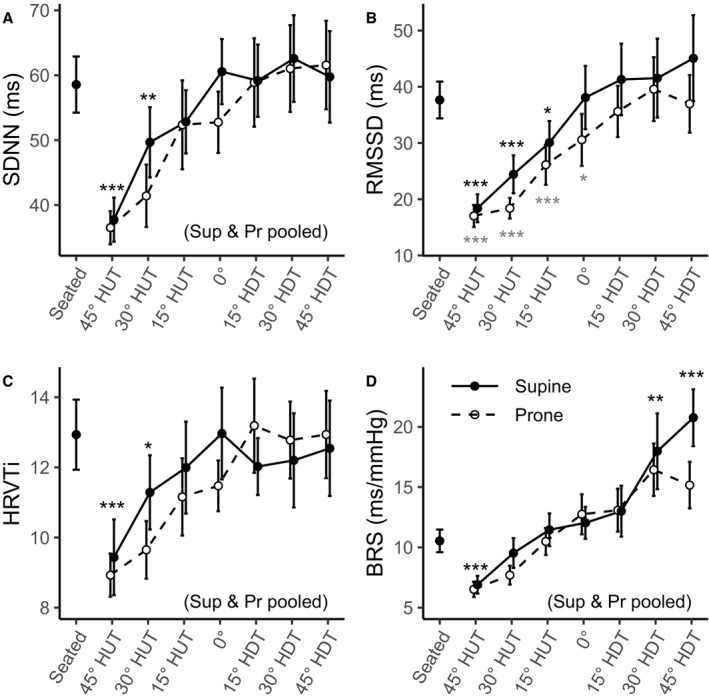
Figure 2. Time‐domain autonomic indices as a function of tilt angle in supine (Sup) (―, •) and prone (Pr) (‐ ‐ ‐, ○) positions, collected on 12 male subjects.

Measurements were taken at a seated baseline, 45° head‐up tilt (HUT), 30° HUT, 15° HUT, 0°, 15° head‐down tilt (HDT), 30° HDT, and 45° HDT. Data are presented as mean±SE at each tilt angle. Asterisks (*; black, supine; grey, prone) indicate statistically significant differences between a specific tilt condition and the seated baseline condition. When the statistical analysis indicated no significant differences between the supine and prone positions, these conditions were pooled (where noted, black asterisks represent both positions together). A, Standard deviation of NN intervals (normalized RR intervals) (SDNN). B, Root mean square of successive differences of NN intervals (RMSSD). C, Heart rate variability triangular index (HRVTi). D, Baroreceptor sensitivity (BRS). ***P<0.001. **P<0.01. *P<0.05.
