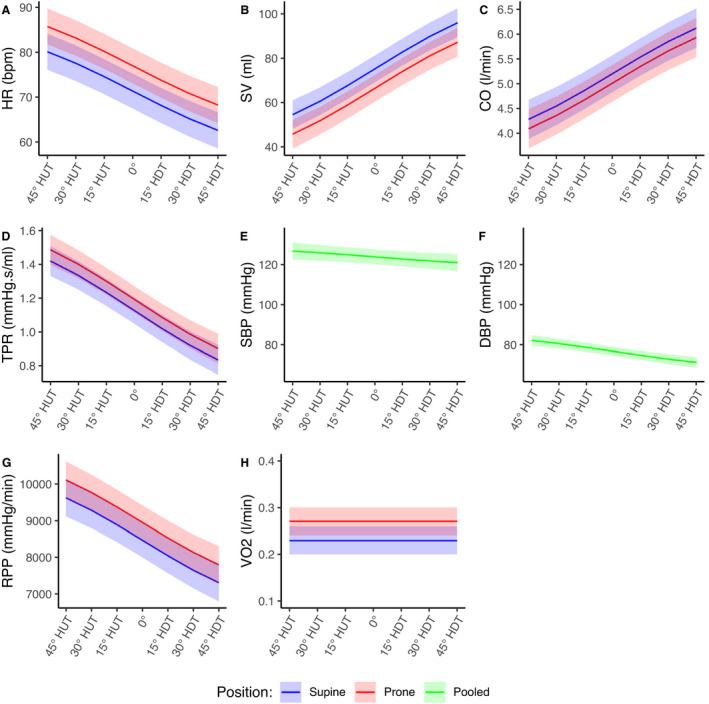
Figure 4. Estimated gravitational dose‐response curves for hemodynamic parameters in the range 45° head‐up tilt (HUT) to 45° head‐down tilt (HDT).

Curves were fit via linear mixed‐effects models as described in the main text. Curves are presented as mean±95% CI. Blue, supine; red, prone; green, supine and prone pooled. A, Heart rate (HR). B, Stroke volume (SV). C, Cardiac output (CO). D, Total peripheral resistance (TPR). E, Systolic blood pressure (SBP). F, Diastolic blood pressure DBP). G, Rate pressure product (RPP). H, Oxygen consumption (VO2).
