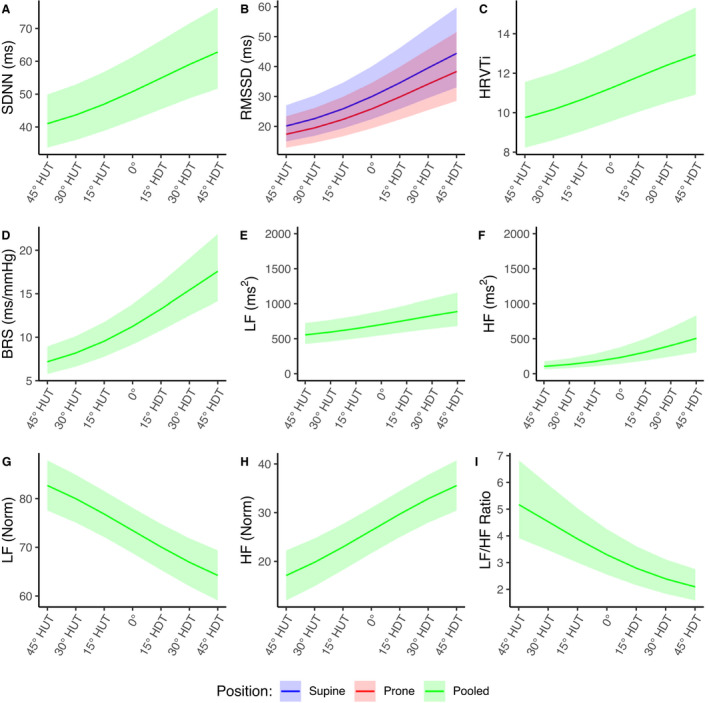
Figure 5. Estimated gravitational dose‐response curves for autonomic parameters in the range 45° head‐up tilt (HUT) to 45° head‐down tilt (HDT).

Curves were fit via linear mixed‐effects models (LFNorm and HFNorm) and generalized linear mixed‐effects models (remaining parameters) as described in the main text. Curves are presented as mean±95% CI. Blue, supine; red, prone; green, supine and prone pooled. A, Standard deviation of NN intervals (normalized RR intervals) (SDNN). B, Root mean square of successive differences of NN intervals (RMSSD). C, Heart rate variability triangular index (HRVTi). D, Baroreceptor sensitivity (BRS). E, Power density in the low frequency range (0.04–0.15 Hz) (LF). F, Power density in the high frequency range (0.15–0.4 Hz) (HF). G, Normalized low frequency (LFNorm). H, Normalized high frequency (HFNorm). I, Ratio of low to high power densities (LF/HF ratio).
