
Figure 2.
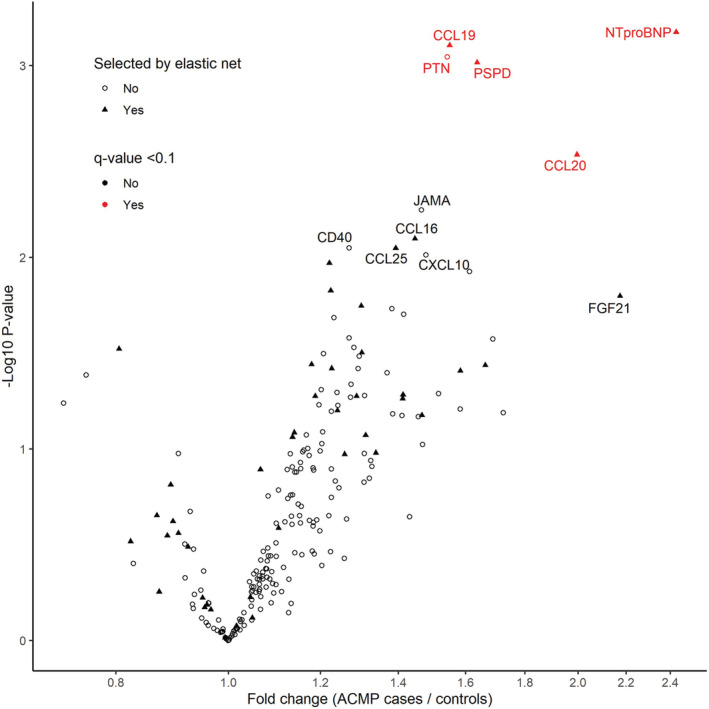
Volcano plot, showing fold changes (x axis) and P values (y axis) of 222 plasma proteins in anthracycline‐related cardiomyopathy (ACMP) compared with matched anthracycline‐treated controls.
Fold changes and P values were estimated with multivariable linear regression analysis, adjusted for sex, time since cancer diagnosis, anthracycline dose, and chest‐directed radiotherapy dose. Significantly upregulated proteins (q value <0.1) are shown in red. Proteins selected by the elastic net in >40% of the cross‐validation folds are shown as a triangle. CCL indicates C‐C motif chemokine ligand; CD40, cluster of differentiation 40; CXCL10, C‐X‐C motif chemokine ligand 10; FGF21, fibroblast growth factor 21; JAMA, junctional adhesion molecule A; NT‐proBNP, N‐terminal pro‐B‐type natriuretic peptide; PSPD, pulmonary surfactant protein D; and PTN, pleiotrophin.