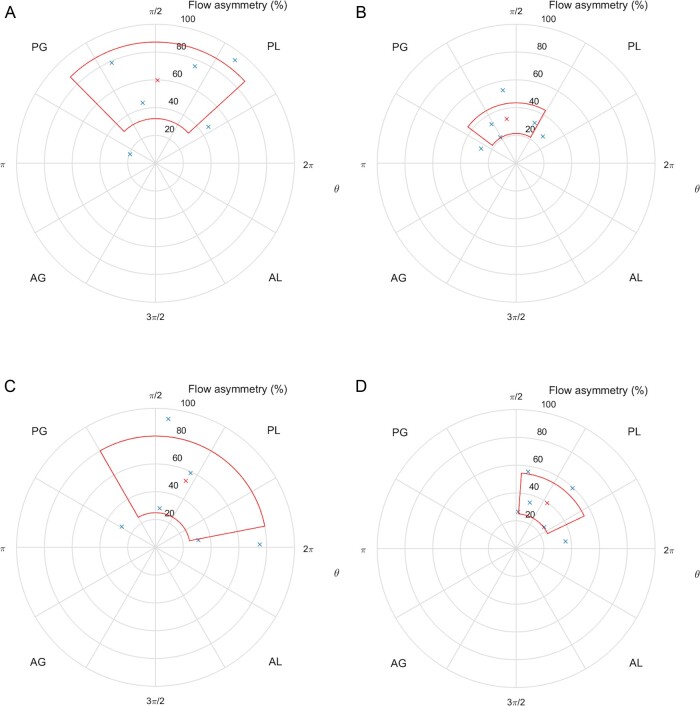
Figure 4.
(A) Position of peak velocity centroids (blue crosses), expressed as flow asymmetry (%), mean (red cross), and standard deviation (red area) in a cross-section of the STJ in the pre-operative BAV group. Coordinates are polar, with θ = 0° at the junction of the AL and PL quadrants. AG, anterior-greater curvature; AL, anterior-lesser curvature; PG, posterior-greater curvature; PL, posterior-lesser curvature. (B) Position of peak velocity centroids (blue crosses), expressed as flow asymmetry (%), mean (red cross), and standard deviation (red area) in a cross-section of the STJ in the post-operative BAV group. (C) Position of peak velocity centroids (blue crosses), expressed as flow asymmetry (%), mean (red cross), and standard deviation (red area) in a cross-section of the STJ in the pre-operative TAV group. (D) Position of peak velocity centroids (blue crosses), expressed as flow asymmetry (%), mean (red cross), and standard deviation (red area) in a cross-section of the STJ in the post-operative TAV group.

