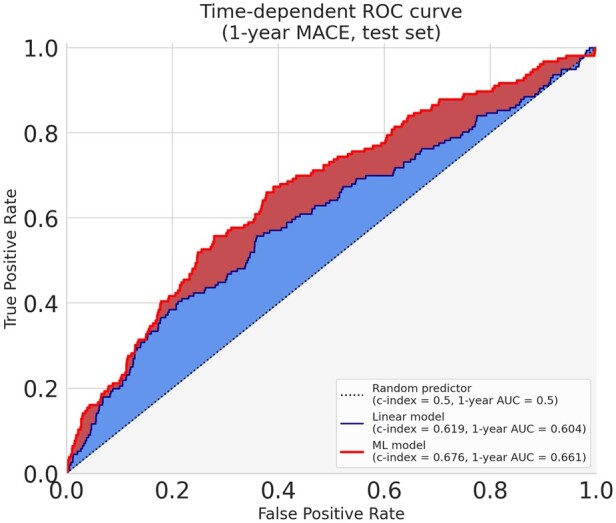
Figure 2.

Time-dependent receiving operator curve. The receiving operator curves illustrate the difference between the best linear and the best model (gradient boosting) in properly attributing a higher risk to patients from the test set who suffered a major adverse cardiovascular event less than a year after their enrolment. We chose the duration of 1 year as it is very close to the median of the recurrence time over our training dataset (353 days). This threshold was only used to evaluate the models and build these curves: the models are the ones evaluated in Table 1 which were trained using the whole follow-up. When arbitrarily calibrating both models to predict less than 30% false positives (specificity > 70%), the gradient boosting model achieves an increase in sensitivity of 11% over the linear one (55% vs. 44%).
