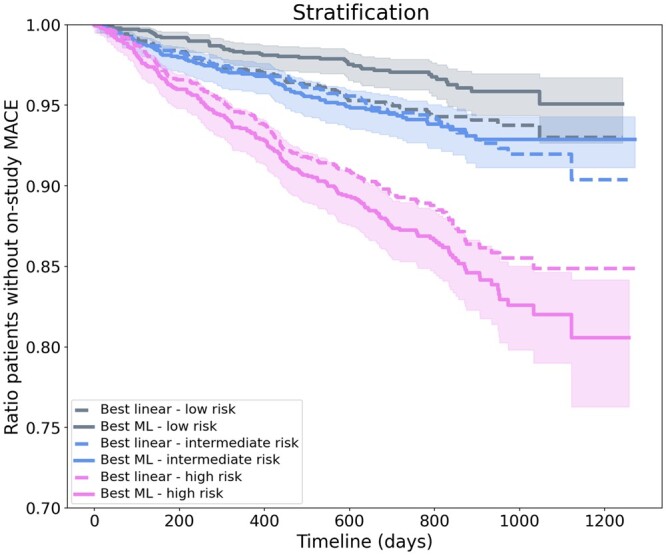
Figure 3.

Stratification of patients based on their risks. The stratification Kaplan–Meier curves show the expectation for the first major adverse cardiovascular event occurrence during the study and its confidence interval for each risk group of the best linear and machine learning models. Taking each group of equal size, these curves illustrate how the best machine learning model achieves a much wider separation between the high- and low-risk patients compared to the best linear model.
