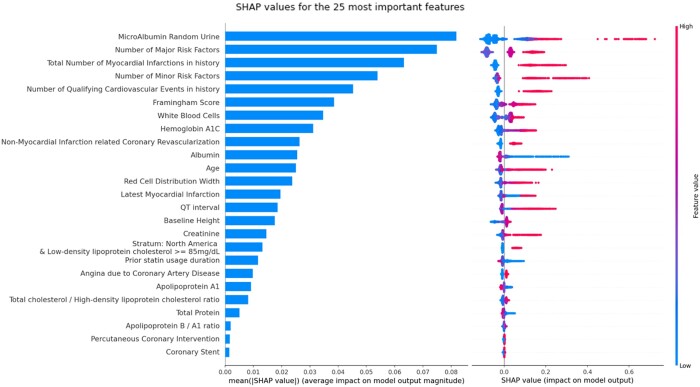
Figure 4.
Best model prognostic features ranking and influence. The SHapley Additive exPlanations values were extracted from the best-performing gradient boosting model on the full set of variables. The left plot illustrates the mean absolute SHapley Additive exPlanations value for each covariate, allowing to select the most important ones for more compact models. The right one provides more detailed information about the direction of these covariates’ influence on the prognosis across the range of values observed for each variable. For example, according to our model on the considered population, it illustrates that having a high value (red point) of microalbumin for random urine tests increases the risk of major adverse cardiovascular events (points on the right).

