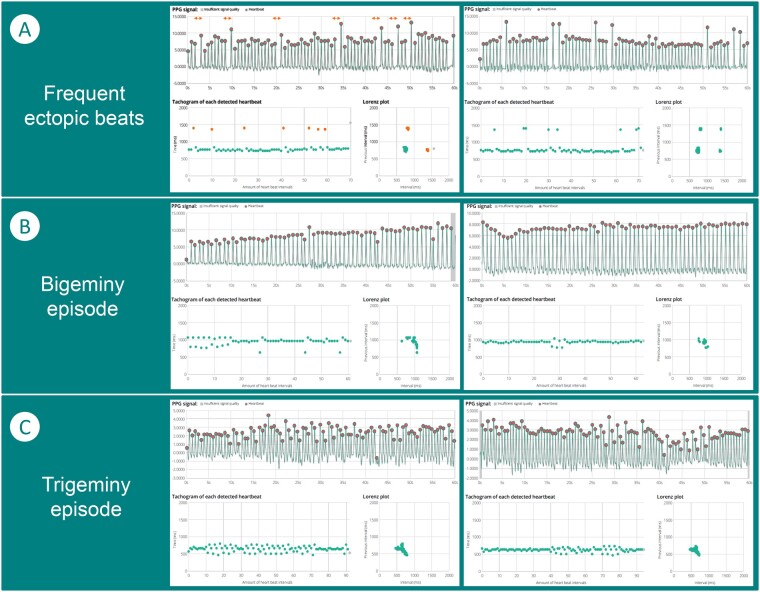
Figure 4.
Ectopic beats. (A) Two recordings with frequent ectopic beats. This can be seen by the bigger pauses between two consecutive beats, indicated in amber in the graphs. In the photoplethysmography signal, the distance between consecutive peaks is larger, which leads to a longer RR-interval in the tachogram and multiple clusters in the Poincaré/Lorenz plot. (B) Two examples of bigeminy episodes, in which the tachogram shows fixed coupled intervals. (C) Two examples of trigeminy episodes, in which the tachogram shows three alternating lines during the episode.

