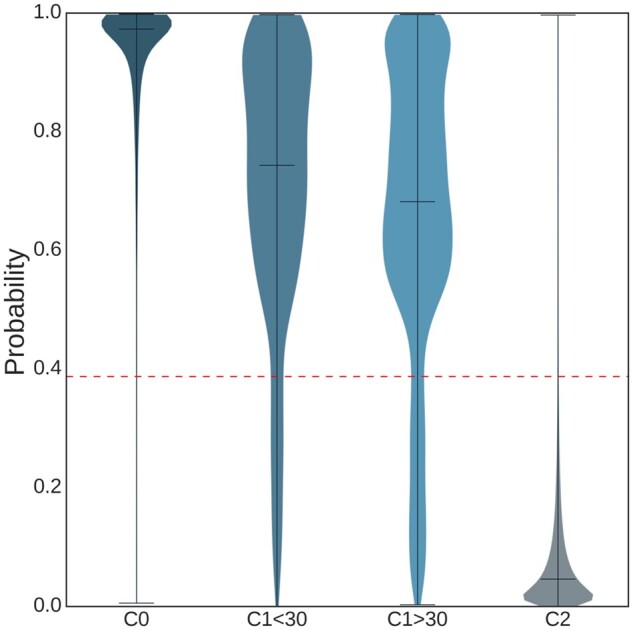
Figure 4.

Violin plot showing the probability distribution for the output of the RF classifiers according to the reference class label, for 13 739 recordings in , 214 recordings in <30, 1948 recordings in >30 and 203 568 recordings in . The dotted red horizontal line depicts the probability decision threshold to classify an example as future AF or not.
