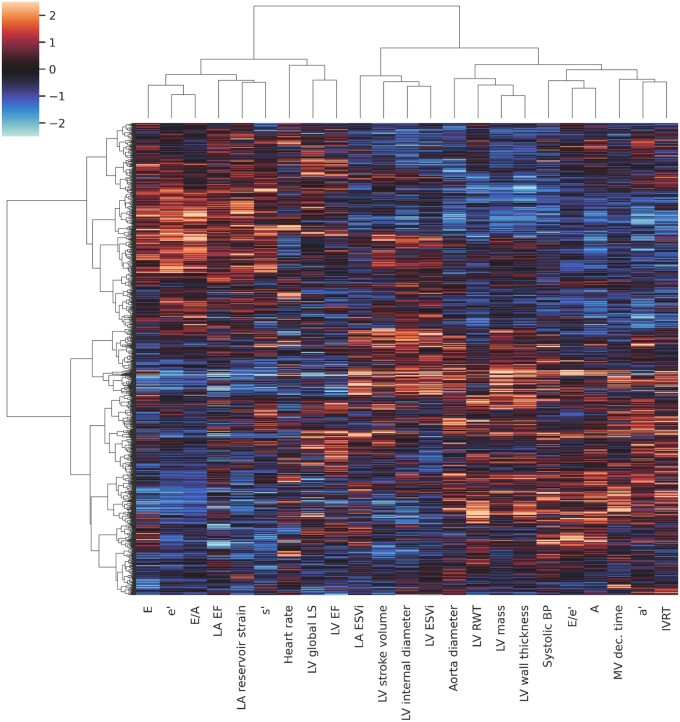
Figure 2.
Phenogrouping heatmap showing grouping of individuals based on agglomerative hierarchical biclustering analysis of echocardiographic and haemodynamic variables. The rows represent individuals, the columns represent features, and the colour indicates z-score of the particular value. Red indicates increased values; blue indicates decreased values. A, late peak diastolic velocity of mitral blood flow; a’, late peak diastolic myocardial velocity; E, early peak diastolic velocity of mitral blood flow; e’, early peak diastolic myocardial velocity; ESVi, end-systolic volume index; IVRT, isovolumetric relaxation time; LV, left ventricular; LA, left atrial; LA EF, left atrial emptying fraction; LV EF, left ventricular ejection fraction; LS, longitudinal strain; MV, mitral velocity; RWT, relative wall thickness; s’, peak systolic myocardial velocity.

