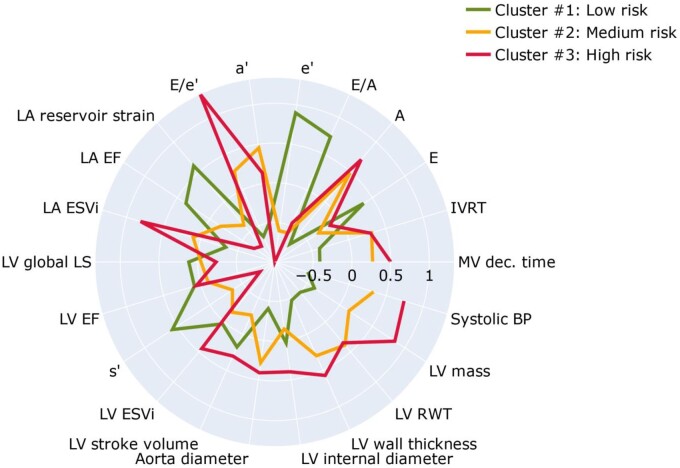
Figure 5.
Radar charts of the echocardiographic features and systolic blood pressure illustrate the superposition of these features in each of the three clusters. The green, orange, and red plot lines compare the cluster standardized values expressed as z-score relative to the population average (0) across all of the 22 dimensions used as inputs to the clustering process. A, late peak diastolic velocity of mitral blood flow; a’, late peak diastolic myocardial velocity; E, early peak diastolic velocity of mitral blood flow; e’, early peak diastolic myocardial velocity; ESVi, end-systolic volume index; IVRT, isovolumetric relaxation time; LV, left ventricular; LA, left atrial; LA EF, left atrial emptying fraction; LV EF, left ventricular ejection fraction; LS, longitudinal strain; MV, mitral velocity; RWT, relative wall thickness; s’, peak systolic myocardial velocity.

