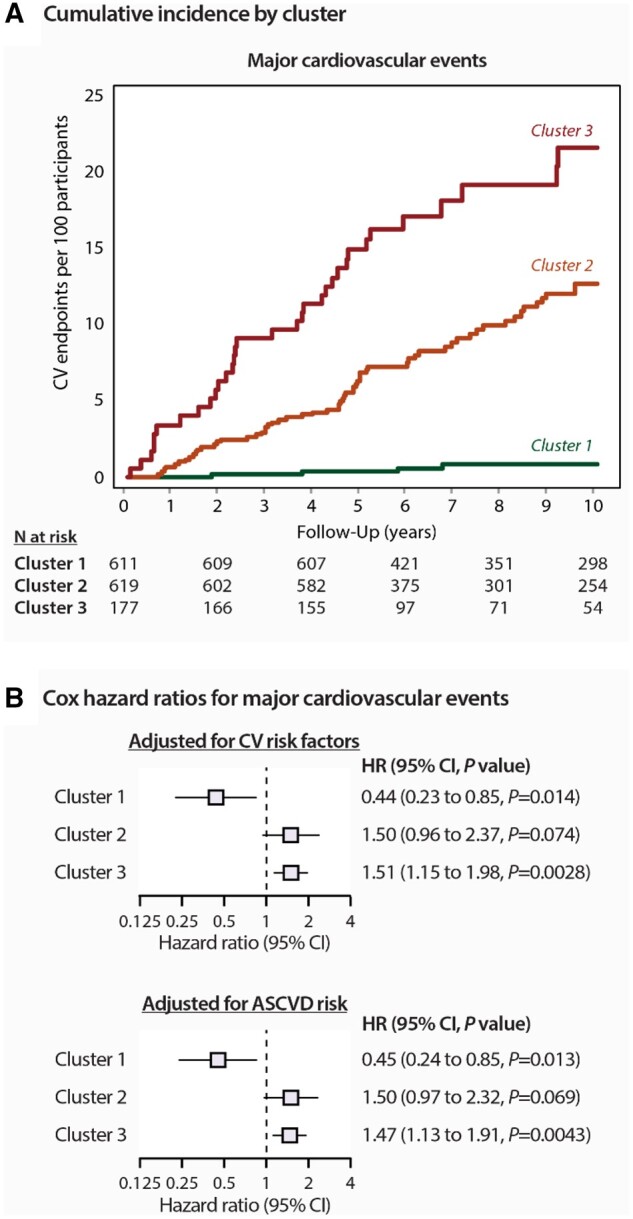
Figure 6.

Risk for major cardiovascular events by phenogroup. (A) Incidence of adverse events are shown by clusters. P log rank was <0.0001 for both plots. (B) Cox regression hazard ratios (95% confidence interval) The hazard ratios express the risks in each cluster compared with the average risk in the whole cohort. In the upper panel, the model was adjusted for the following the covariables: sex, age, body mass index, serum cholesterol, current smoking, antihypertensive drug treatment, and diabetes mellitus. In the bottom panel, the model was adjusted for ASCVD risk score.
