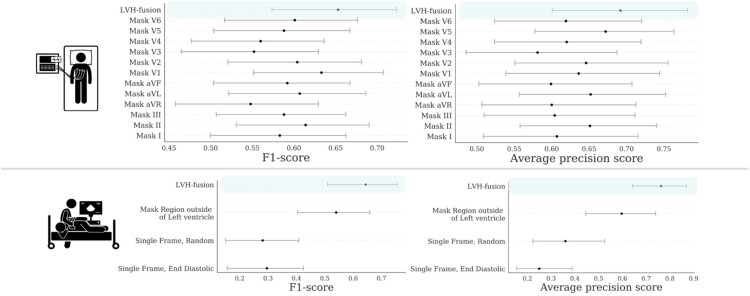
Figure 2.
Ablation studies impact on model performance. Bootstrap 95% CI for performance metrics, F1-score and average precision score, for each model trained on ablated input data. for each prediction metric is shown. (TOP row) Results from ablating ECG input. (BOTTOM row) Results from ablating echocardiogram input. For each ablation setting, a separate model was trained on that type of ablated data to quantify the information content in the data.

