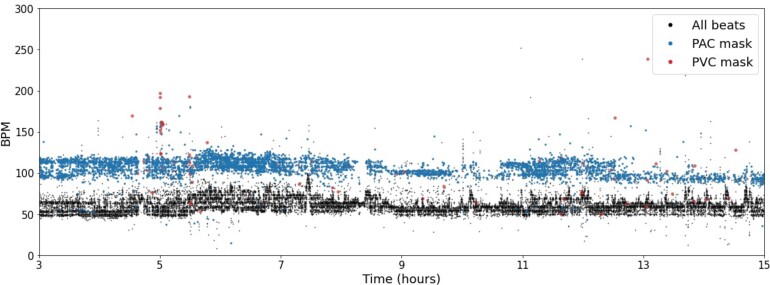
Figure 3.
Heart-rate plot. A heart-rate plot is a three-dimensional representation of every beat’s instantaneous heart rate during the Holter recording. The x-axis represents time, while the y-axis represents the heart rate in b.p.m. The z-axis consists of three channels that correspond to each beats classification of either: normal, pre-mature atrial contraction, or pre-mature ventricular contraction. The onset of the beats and classification of normal, pre-mature atrial contraction, or pre-mature ventricular contraction were automatically computed by the Cardiologs Holter Platform. The heart-rate plots cover a 12-h window with a resolution of 36 s per time bin/column and 1 b.p.m./heart rate bin/row. The final input has a size of 1200 × 300 × 3.

