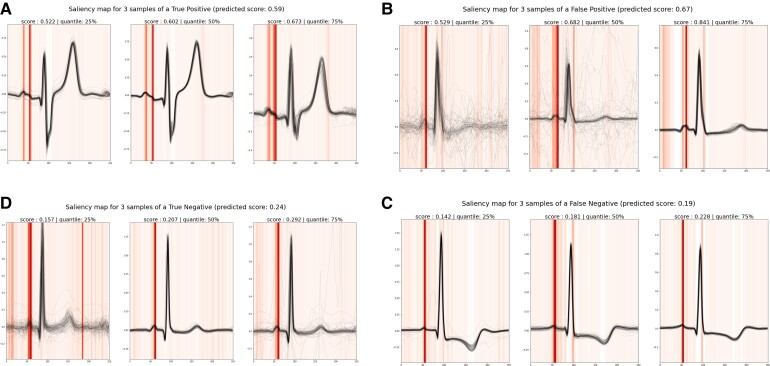
Figure 6.
Beat-deep neural network interpretability. Saliency maps are given for four Holters (A–D). For each of them, three samples are shown corresponding to median, first, and last quartile of prediction scores of the recording’s samples. All 80 beats of each sample are plotted in black. The saliency map averaged across the 80 beats is shown in vertical lines (in red). For all recordings, the P wave is the main region of importance. Holters (C) and (D), respectively, are true negative (Holter with no atrial fibrillation predicted from the first 24 h and no atrial fibrillation observed within the 2 following weeks) and false negative (Holter with no atrial fibrillation predicted from the first 24 h and atrial fibrillation observed within the 2 following weeks), showing low prediction scores and a normal P wave with a single mode on which the network focuses. On the contrary, Holters (A) and (B), respectively, are true positive and false positive, showing high prediction scores with characteristics of a bifid P-wave. For these recordings, the model focuses on the two modes of the P waves. These examples highlight the importance of the P-wave morphology for the Beat-deep neural network predictions.

