Figure 3.

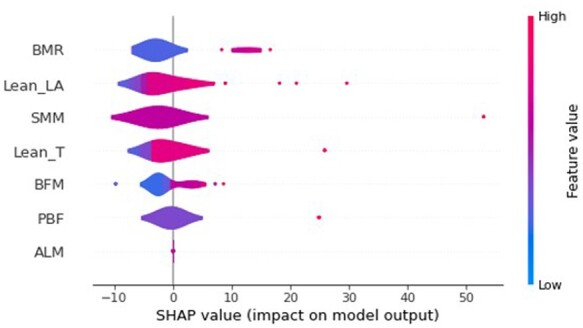
Summary plot describing the relationship between the value of the feature and the impact on the prediction within the train set. Only the top seven features were displayed.

Summary plot describing the relationship between the value of the feature and the impact on the prediction within the train set. Only the top seven features were displayed.