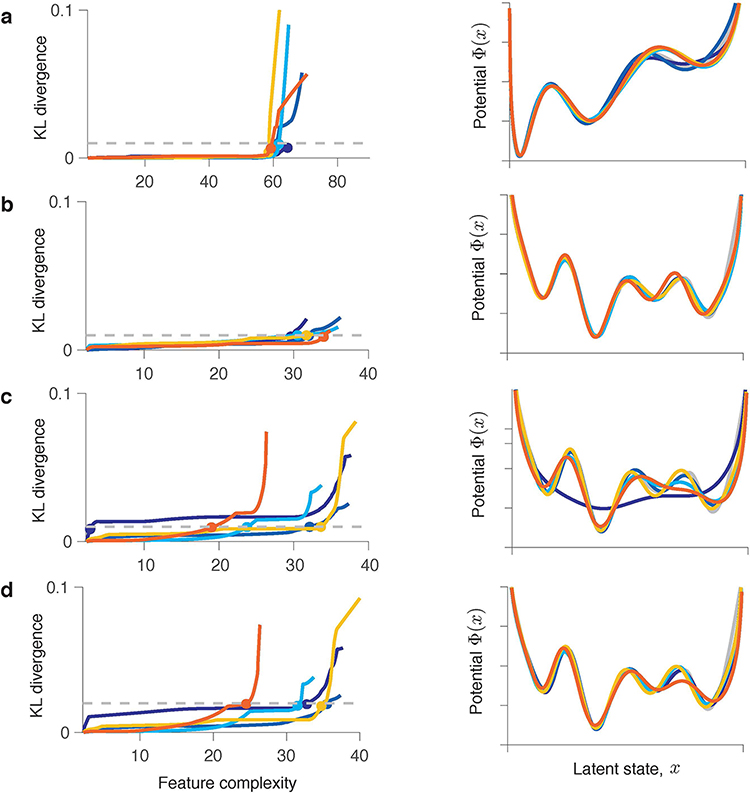
Extended Data Fig. 5. Model selection using feature consistency method for complex potential shapes.
Simulations are shown for five independent data samples generated from the same ground-truth model. Each coloured line represents one simulation. The KL-divergence (left column) between models discovered from two halves of each data sample at different levels of feature complexity. Models are selected at the feature complexity (coloured dots) where the KL-divergence exceeds the threshold (dashed line). The selected models (right column) are consistent across data samples and with the ground truth when the data amount is sufficient (a,b). Underfitting can occur for low data amounts (c,d). (a) The ground-truth is a triple-well potential with the shape inferred for the example V4 channel (Fig. 6e in the main text). Each data sample contains roughly 30,000 spikes.. (b) The ground-truth is a complex four-well potential. Each data sample contains roughly 400,000 spikes.. All five KL-curves exceed the KL-threshold. The sharp rise of KL-divergence is not yet apparent for this number of GD iterations. (c) The same ground-truth potential as in b. Each sample of synthetic data contains roughly 200,000 spikes.. Some of the selected models are underfitted. (d) The same data as in c but with a higher KL-threshold . Increasing reduces underfitting of these complex dynamics resulting in more correct outcomes, but it also increases the probability of overfitting for simple ground-truth dynamics.

