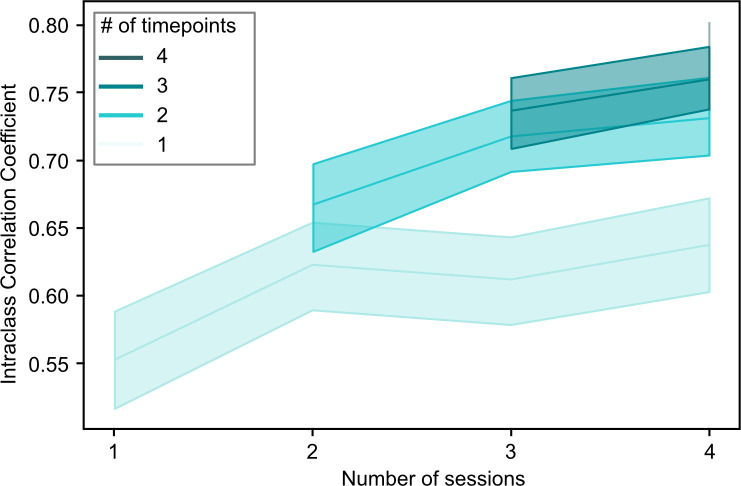
Figure 3. Overview of the relationship between the stability of continuous subtype assignments (Intraclass Correlation Coefficients) and the amount of data used to compute these assignments.
Continuous subtype assignments were computed on samples in longitudinal sample 2 (n=26, 10 sessions per participant) and for pairs of single scan sessions, or for pairs of averages of multiple scan sessions (2–4, horizontal axis). We also controlled the total number of time points included in the averages to be the length of a single (light green) or multiple sessions (darker green hues). Opaque lines represent the average ICC across repeated samples of session pairs, and shaded areas reflect the 95% confidence interval. This analysis allowed us to investigate whether changes in stability were driven more by the inclusion of multiple sessions, or by the total amount of timepoints included in the average.

