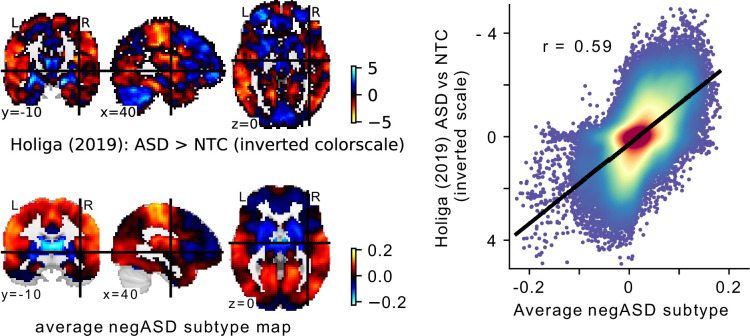
Figure 8. Comparison of the average negASD FC-subtype map to a case-control signature.
(a) The spatial map of a large sample size case-control contrast between ASD and NTC individuals (top row), compared to the average spatial map of the negASD FC-subtypes identified on our data (bottom row). Note that because of the opposite nature of the two contrasts (i.e. ASD >NTC for the case-control contrast and NTC >ASD for the negASD FC-subtype map), the color scale for the case-control map has been inverted for better comparability. (b) Plot of the voxel-wise spatial correlation between the (inverted) case-control contrast map and the average negASD FC-subtype map. The blue to red color gradient reflects the density of voxels represented in each area of the graph.

