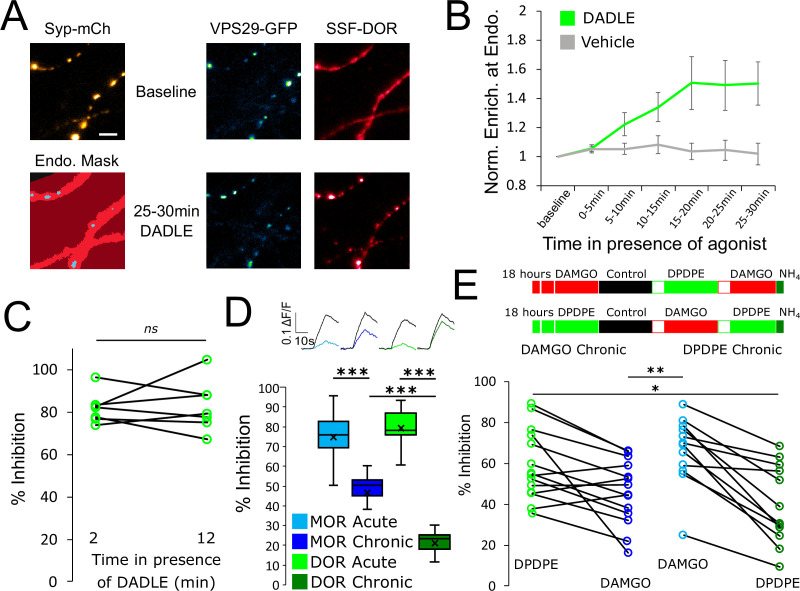
Figure 4. Tolerance is an homologous process conserved between opioid receptors.
(A) Representative images of axons of neurons marked with syp-mCh, expressing the endosomal marker VPS29-GFP and FLAG-tagged DOR (SSF-DOR) surface labeled with a primary anti-FLAG antibody conjugated to alexa647. Imaging was performed as described before. Note the uniform distribution of surface SSF-DOR before agonist addition (baseline) and the punctate distribution overlapping with a segmented mask of the endosomal marker after 25–30 min of incubation with DADLE 10 μM. Scale bar is 5 μm. See also Figure 4—video 1. (B) Time course of surface labeled SSF-DOR recruitment at VPS29-GFP marked presynaptic endosomes, as in A. There is a significant increase in colocalization of SSF-DOR with the retromer marker after addition of DADLE 10 μM (n=11 acquisitions) compared to the vehicle control (n=7 acquisitions). (C) Inhibition of electrically evoked exocytosis of synaptic vesicles by DOR is sustained over 10 min in presence of agonist. Desensitization of presynaptic DOR was assessed using a similar protocol as in Figure 1E. Neurons expressing SSF-DOR and VAMP2-SEP were electrically stimulated to induce SV exocytosis in control solution. Cells were then perfused with a solution containing DADLE 10 μM and inhibition of the fluorescence increase was quantified to reflect DOR mediated presynaptic inhibition. After 10 more minutes of perfusion with DADLE, cells were stimulated again to estimate the degree of acute desensitization (n=7 acquisitions). (D) Quantification of the presynaptic inhibition mediated by MOR in acute and chronic conditions (replotted from Figure 1C) compared to DOR, acutely (inset n=1,482 synapses, n=10 acquisitions) or after 18 hr of treatment with DADLE 10 μM (inset n=2,529 synapses, n=11 acquisitions). (E) Assessment of cross-tolerance using optical measurement of presynaptic inhibition. Inset describes experimental setup. Neurons expressing VAMP2-SEP together with SSF-DOR and SSF-MOR were incubated for 18 hr with either DAMGO 10 μM (n=14 acquisitions) or DPDPE 10 μM (n=12 acquisitions). Cells treated chronically with DAMGO were electrically stimulated while imaged in control solution, then 2 min after perfusion with 10 μM DPDPE, then 2 min after exchange for a solution containing 10 μM DAMGO. Cells treated chronically with DPDPE were submitted to the same protocol, except that the order of solution perfusion was reversed (DAMGO first, DPDPE second). *, **, *** represent p<0.05, 0.01, 0.001, respectively. See also Figure 4—source data 1.

