. 2022 Nov 2;11:e80956. doi: 10.7554/eLife.80956

Figure 1. Inducing Lgl knockdown in follicle cells causes distinct phenotypic and transcriptomic changes.

(A) Left: orthogonal projection of a single ovariole displaying individual egg chambers containing experimental control follicle cells at early and midoogenesis. Follicle cells at mitotic stages are infrequently detected by pH3 staining (green), while endocycling follicle cells at midoogenesis are labeled by Hnt staining (red). Right: ovariole containing egg chambers with Lgl-KD in follicle cells exhibit continued cell division (marked by pH3 staining in green) in cells that accumulate at egg chamber termini (arrowheads) at early-to-midoogenesis developmental transition and midoogenesis. Degenerated egg chambers containing dying germline cells are marked by asterisks (*). Scale bars: 50 µm. Distinct Hnt and pH3 staining within the Lgl-KD multilayers are highlighted for the region of interest (ROI) within the image. ROI scale bar: 20 µm. (B) Left: cross-section of the posterior egg chamber epithelia containing experimental control follicle cells that exhibit intact Shg (DE-Cad) staining at cell junctions. Middle and right: posterior multilayers of egg chambers containing Lgl-KD in follicle cells show declining enrichment (green) of Armadillo (Arm; middle panel) and Shg (DE-Cad; right panel) along the anterior–posterior (AP) axis (right to left). F-actin (red) is found enriched in cells at the apical-most layers; leading edge of the invasive front is indicated by an arrowhead. Nucleus is marked by DAPI (white). Scale bars: 20 µm. (C) Relative enrichment of F-actin (red) and Shg (DE-Cad; green) along the AP axis across the biggest distance between the apical-most and basal-most cells in the multilayer shown in (B) (right panel). Intensities are measured across a 10 µm thickness (Z-axis) and a trendline (Gaussian fit) is shown. The black arrowhead marks the leading edge corresponding to that shown in (B). (D) Box-and-whisker plot showing quantification of the different tjTS>lglRNAi (72 hr in permissive temperature) phenotypes. Data was collected from five replicate trials (color-coded individually), consisting of 1250 intact ovarioles from a total of 165 flies. (E) Principal component analysis (PCA) plot showing the distribution of whole-tissue RNA-seq samples for tjTS experimental controls kept for 24 hr and 96 hr in permissive temperature and their experimental counterparts containing tjTS>lglRNAi. Each uniquely colored sample has two replicates that are grouped. (F) Overview of the single-cell (sc) RNA-seq workflow to isolate follicle cell-specific clusters from 14,537 tjTS>lglRNAi ovarian cells, embedded on lower UMAP dimensions (top). Clusters containing nonepithelial cell types are identified by the enrichment of specific markers (bottom).

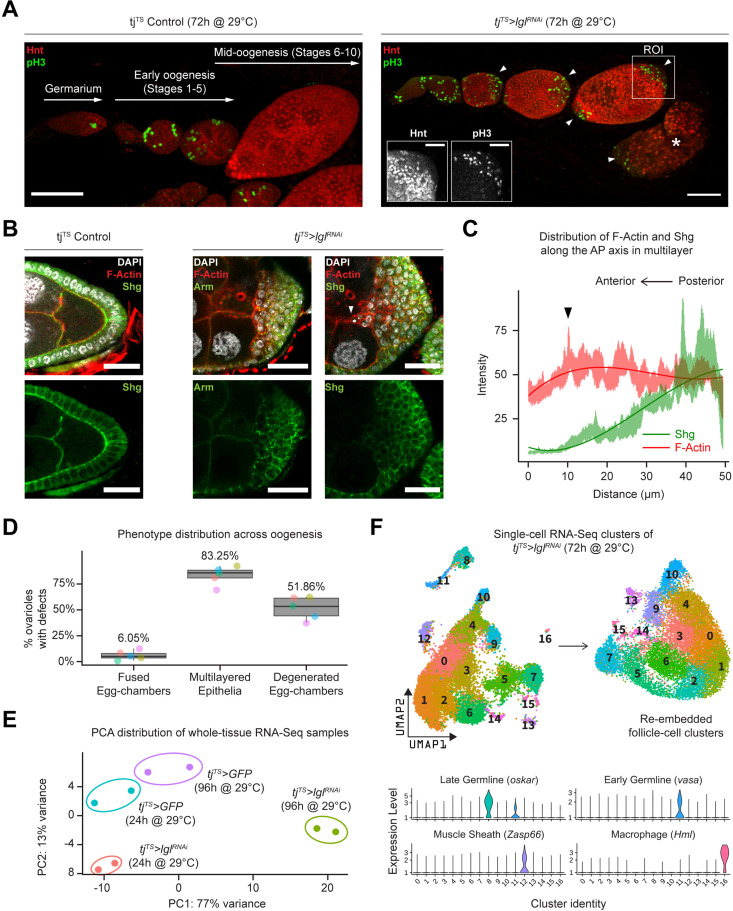
Figure 1—source data 1. Raw data for (unnormalized) IntDen values of RFP, GFP, and DAPI enrichment.
Related to Figure 1C.
Figure 1—source data 2. Quantification of the stage-specific phenotypic characterization of ovarioles containing egg chambers with 96 hr Lgl-KD in their follicle cells.
Related to Figure 1D.

Figure 1.

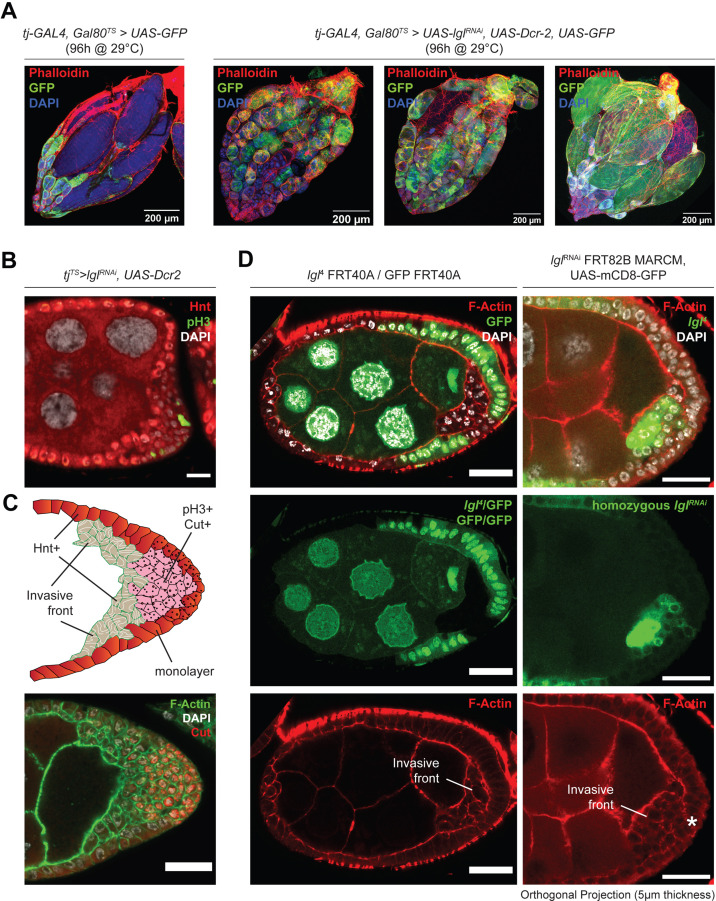
Figure 1—figure supplement 1. Lgl loss of function in follicle cells causes invasive multilayering and cell fate heterogeneity.

Figure 1—figure supplement 1.

(A) Confocal images of tjTS-driven Lgl-KD ovaries (right) compared to that of a tjTS experimental control (left). Inducing Lgl-KD in follicle cells causes late-stage egg chambers to abort germline development, which leads to an accumulation of follicle cells near the oviduct (top-right part of the image). Some egg chambers also exhibit the accumulation of fully developed eggs posteriorly within the ovarian sheath (right-most column). F-actin is marked by Phalloidin (red), nucleus with DAPI (blue) and GFP (green) marks the follicle cells. Scale bars, 200 µm. (B) Confocal Image of an egg chamber cross-section shows the mutually exclusive enrichment of the endocycling follicle cell marker Hnt and that of the mitotic marker pH3. (C) Top panel: model depicting apically invasive multilayers exhibiting cell fate heterogeneity. Spatially restrictive marker expression and terminologies are indicated. Lower panel: cut expression is observed in the basally enriched cells. Nucleus is marked by DAPI (white) and F-actin is marked by Phalloidin (green). Scale bars: 20 µm. (D) Confocal images of egg chambers containing mitotic clones of homozygous (GFP-) lgl4 follicle cells (left column) and GFP+ MARCM clones of homozygous lglRNAi follicle cells (right column). Panel visualizing the MARCM clones was generated by orthogonally projecting Z-stacks across 5 µm thickness. Nucleus is marked by DAPI (white), and F-actin is marked by Phalloidin (red). Scale bars: 20 µm.
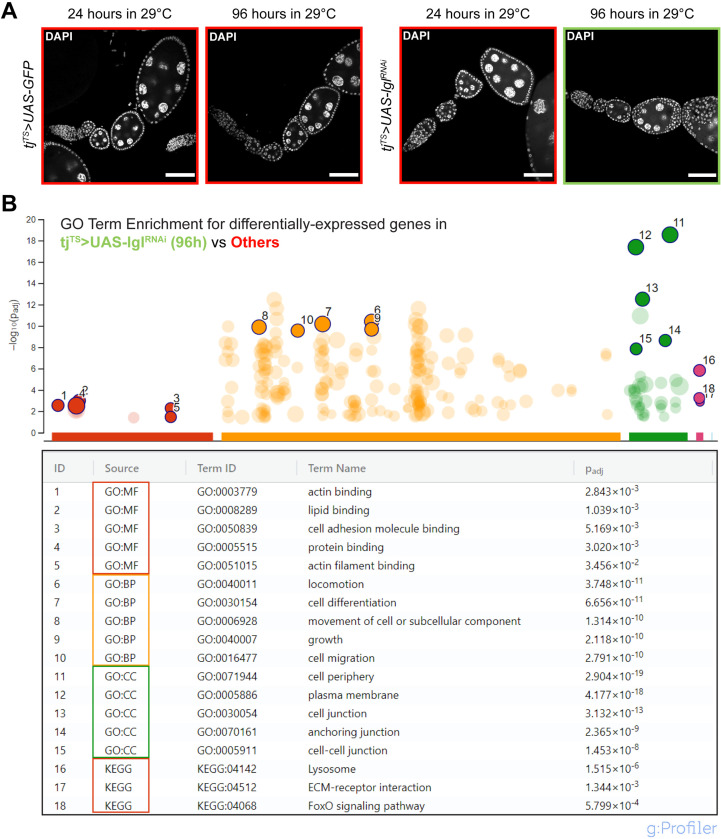
Figure 1—figure supplement 2. Whole-tissue RNA-seq of samples containing multilayered Lgl-KD follicle cells.

Figure 1—figure supplement 2.

(A) Representative confocal images of representative ovarioles from the four samples used as input for RNA-seq analysis. Nucleus is marked by DAPI (white). Scale bars: 50 µm. (B) Enriched Gene Ontology (GO) Terms in the 477 differentially expressed genes found by comparing 96h-Lgl-KD samples (marked by green border in A) with the rest of the samples (marked by red borders in A). The highlighted GO Terms are mentioned in the table below with their corresponding adjusted p-values.
Figure 1—figure supplement 2—source data 1. Differentially expressed genes in 96h-Lgl-KD vs. others comparison.
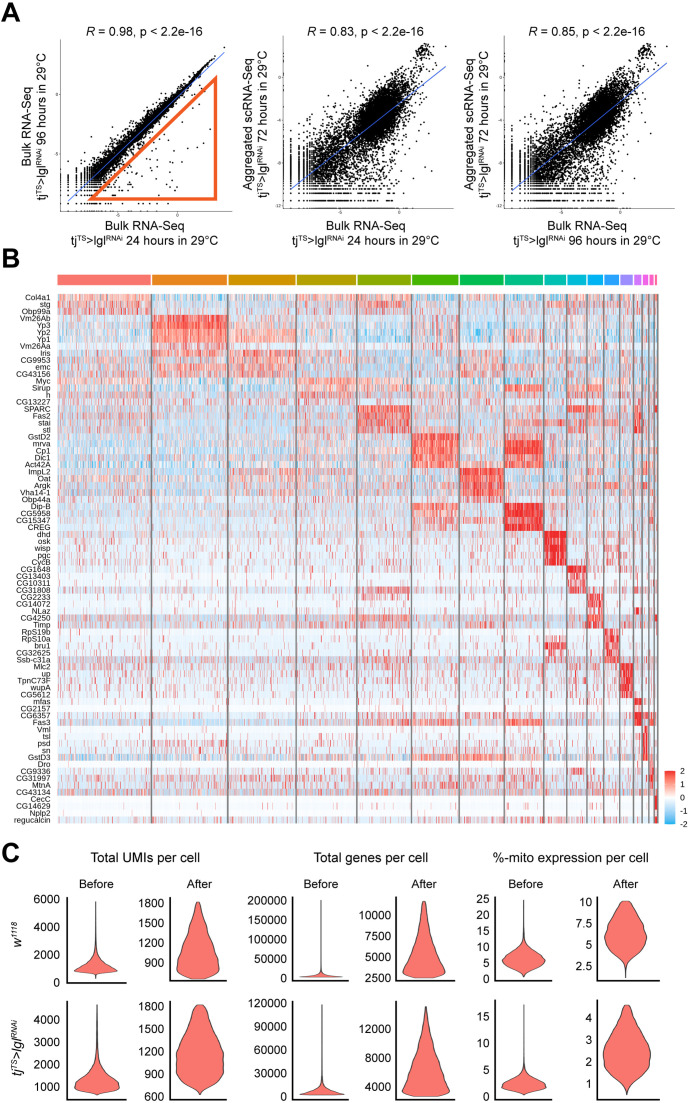
Figure 1—figure supplement 3. Single-cell RNA-seq of ovaries with 72h-Lgl-KD follicle cells.

Figure 1—figure supplement 3.

(A) Scatter plots depicting the correlation between the different RNA-seq samples. Red triangle in the left plot represents markers from late development stages of oogenesis, representing the late-stage failure in 96h-Lgl-KD follicular development. Middle and right columns depict the similarities between the log-normalized counts of bulk RNA-seq datasets (X-axis) and aggregated single-cell RNA-seq dataset (Y-axis). (B) Heatmap showing the expression of cluster-specific markers in each cluster shown in the UMAP plot in Figure 1F for the 72h-tjTS>lglRNAi dataset before subsetting. (C) Violin plots showing the distribution of total UMI per cell (left column), total genes per cell (middle column), and percentage of cells expressing mitochondrial genes per cell (right column) before and after filtration. Top row represents isolated w1118 follicle cells while bottom row represents tjTS>lglRNAi follicle cells.
Figure 1—figure supplement 3—source data 1. Cluster-specific markers of the tjTS>lglRNAi (72 hr) single-cell RNA-seq (scRNA-seq) dataset.