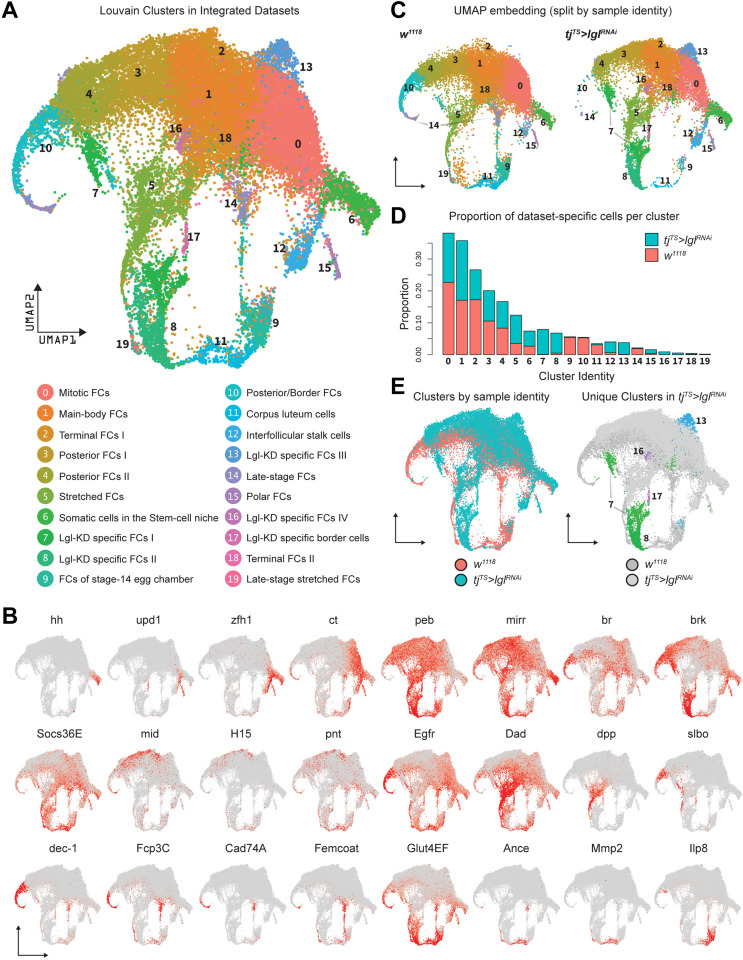
Figure 2. Integration of w1118 and tjTS>lglRNAi single-cell datasets identifies sample-specific clusters.
(A) UMAP plot of 17,874 w1118 follicle cells integrated with 12,923 tjTS>lglRNAi follicle cells, grouped into 20 clusters, with their approximated identities listed below. (B) Canonical marker expression used to annotate the 20 integrated clusters reveals cluster-specific identities of the somatic cells of the stem cell niche (hh), polar follicle cells (upd1), stalk cells (zfh1), immature mitotic follicle cells (ct), mature postmitotic cells (peb), main body follicle cells (mirr and br), terminal follicle cells (brk, Socs36E and Egfr), posterior follicle cells (mid, H15, and pnt), stretched cells (Dad and dpp), border cells (slbo), follicle cells of the vitellogenic (dec-1) and choriogenic stages (Fcp3C, Cad74A, Femcoat, and Glut4EF), and the cells of the terminally fated corpus luteum (Ance, Mmp2, and Ilp8). (C) Distribution of clusters on the UMAP embedding is shown split by sample ID. (D) Bar plot showing the relative proportion of cells in each cluster. Each bar is further divided by the dataset of origin (w1118 is represented by salmon color and tjTS>lglRNAi by teal). (E) UMAP plot showing the overlap between cells from each dataset (left) and clusters unique to the 72h-tjTS>lglRNAi dataset (right).

