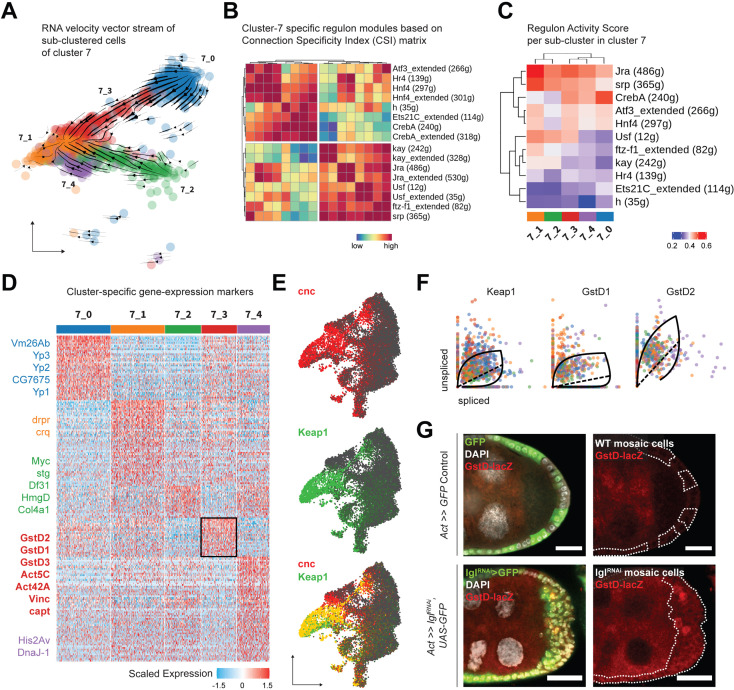
Figure 4. Cluster 7 cells exhibit heterogenous gene expression and regulon activity.
(A) UMAP plot of subdivided cluster 7 cells, superimposed with RNA velocity vectors. (B) Heatmap representing regulon–regulon correlation based on Connection Specificity Index (CSI) of active regulon modules. Both high-confidence and low-confidence (marked by the ‘_extended’ suffix) transcription factor (TF) associations are plotted. (C) Heatmap of the unscaled activity scores of regulons in the subclusters of cluster 7. (D) Heatmap of the (relatively) differentially expressed markers of each subcluster of cluster 7 cells, scaled within +1.5 (red) and –1.5 (blue) log2 fold change. Select markers are mentioned, while those of cluster 7_3 (denoted by black border on the heatmap) are highlighted in bold. (E) Gene enrichment plot for cnc (red), Keap1 (green), and their overlap (bottom). (F) Phase portraits showing dynamic behavior of genes in cluster 7 cells (colored by their subcluster ID as shown in panel A). Solid line represents the learned splicing dynamics while the dotted line represents the inferred gene expression steady state. Keap1, GstD1, and GstD2 exhibit an acute increase in transcription in cluster 7 cells. (G) Reporter expression of GstD-lacZ is detected by β-gal expression (red) within the multilayered cells of lglRNAi follicle cells (green; clonal boundaries are marked by the dotted white lines). Nuclei is marked by DAPI (white). Scale bars: 20 µm.


