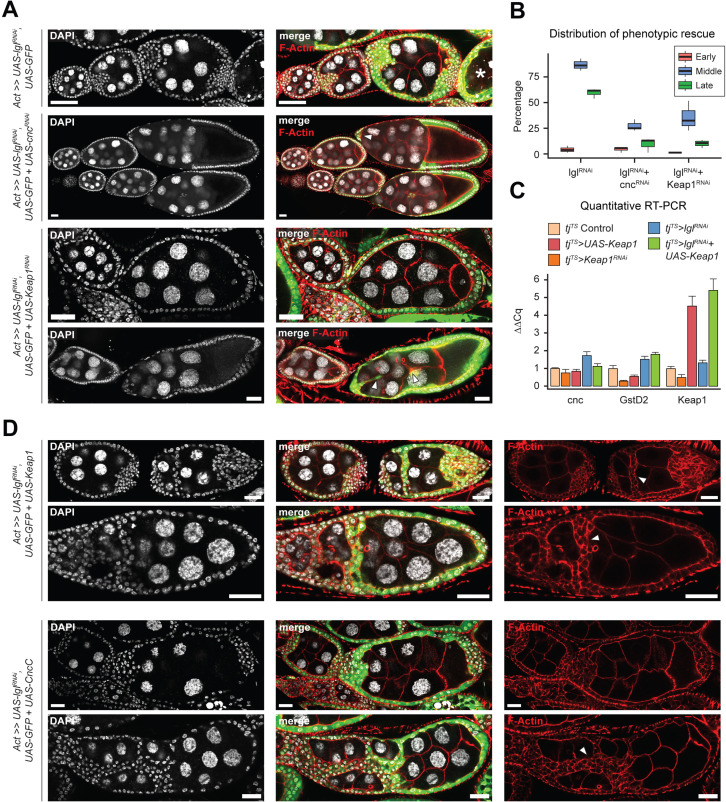
Figure 5. Keap1-Nrf2 signaling drives invasiveness of Lgl-KD multilayers.
(A) Representative confocal images of ovarioles containing egg chambers with transgene expression in follicle cells (green) driving Lgl-KD (top), Lgl-KD+Cnc-KD (middle), and Lgl-KD+Keap1-KD (bottom panels). Degenerating egg chambers are marked by asterisks (*). Border cell migration defects are indicated by arrowheads. Nucleus is marked by DAPI (white). F-actin is marked by Phalloidin (red). Scale bars: 20 µm. (B) Box-and-whisker plot showing the quantification of phenotypic rescue at early (red), mid (blue), and late (green) oogenesis. For the multilayering phenotype at midoogenesis, we have only counted instances of >2 follicular layers. (C) Bar plot showing relative expression levels of genes involved in the Keap1-Nrf2 signaling pathway in relevant genotypes (N = minimum 10 pairs of ovaries). Samples are color-coded as shown in legend and the error bars represent Standard Error (SE). (D) Confocal images of ovarioles with Lgl-KD+Keap1-OE (above) and Lgl-KD+CncC-OE (below) in follicle cells (green). Arrowheads mark the epithelial bridging or fusion phenotype. Nucleus is marked by DAPI (white). F-actin is marked by Phalloidin (red). Scale bars, 20 µm.


