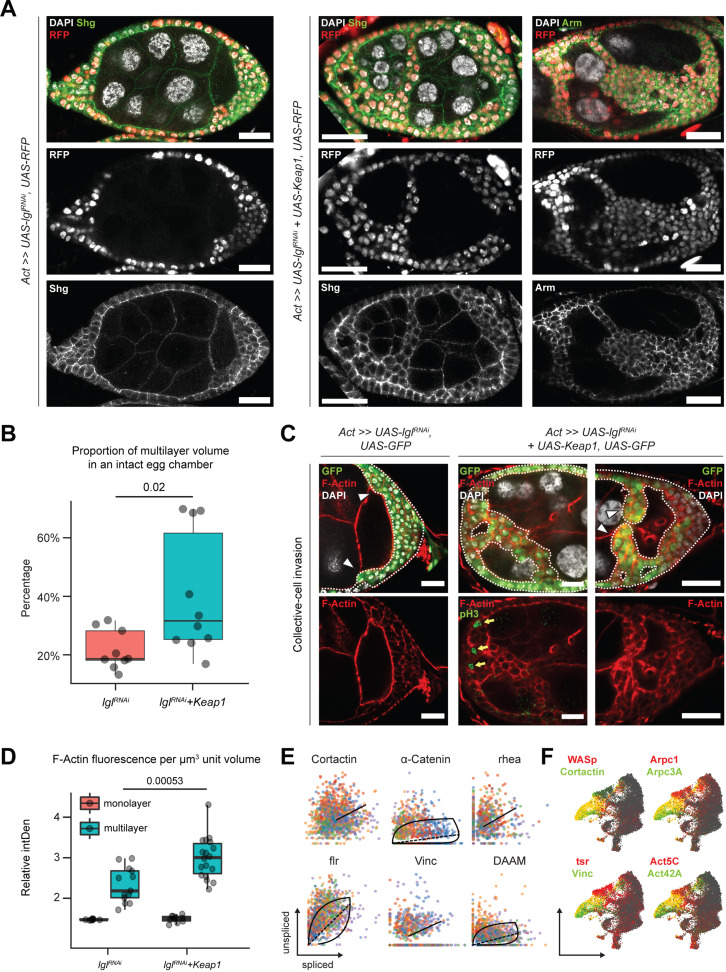
Figure 6. Invading Lgl-KD+Keap1-OE cells exhibit extensive cytoskeletal remodeling.
(A) Confocal images of egg chambers with Lgl-KD (left) and Lgl-KD+Keap1-OE (middle and right panels) in the follicle cells (red; shown in the middle row). Egg chambers are stained with Shg (DE-Cad; left and center columns) and Arm (right column) (green). Nucleus is marked by DAPI (white). F-actin is marked by Phalloidin (red). Follicle cells with transgene expression are separately shown in the middle row, while Shg and Arm staining intensities are shown in the bottom row. Scale bars, 20 µm. (B) Box-and-whisker plot showing the proportion of delaminated epithelial volume of Lgl-KD (N = 9 egg chambers) and Lgl-KD+Keap1-OE (N = 10) follicle cells compared to the volume of the entire egg chamber. The p-value (p=0.02) obtained from t-test comparing the two samples is listed on top. (C) Confocal images of collectively invading follicle cells (green) in Lgl-KD (left) and Lgl-KD+Keap1-OE (middle and right). Nucleus is marked by DAPI (white). F-actin is marked by Phalloidin (red). Invasive fronts are marked by arrowheads. Positive pH3 staining (green in bottom middle panel) shows mitotically dividing cells, marked by yellow arrows. Scale bars, 20 µm. (D) Box-and-whisker plot to show the relative intensities of F-actin in the monolayer (red) and multilayers (teal) of egg chambers with Lgl-KD (N = 10 egg chambers) and Lgl-KD+Keap1-OE (N = 10) follicle cells. Individual egg chambers are shown as distinct dots. The p-value (p=0.00053) obtained from t-test comparing the two samples is listed on top. (E) Phase portraits of cytoskeletal genes in cluster 7. Straight line indicates that the gene exhibits steady-state dynamics, while curved solid line with dashed straight line represents upregulation. Cells are colored according to their subcluster identity. (F) Gene enrichment plot shows overlapping enrichment of actin-remodeling genes in cluster 7 cells.


