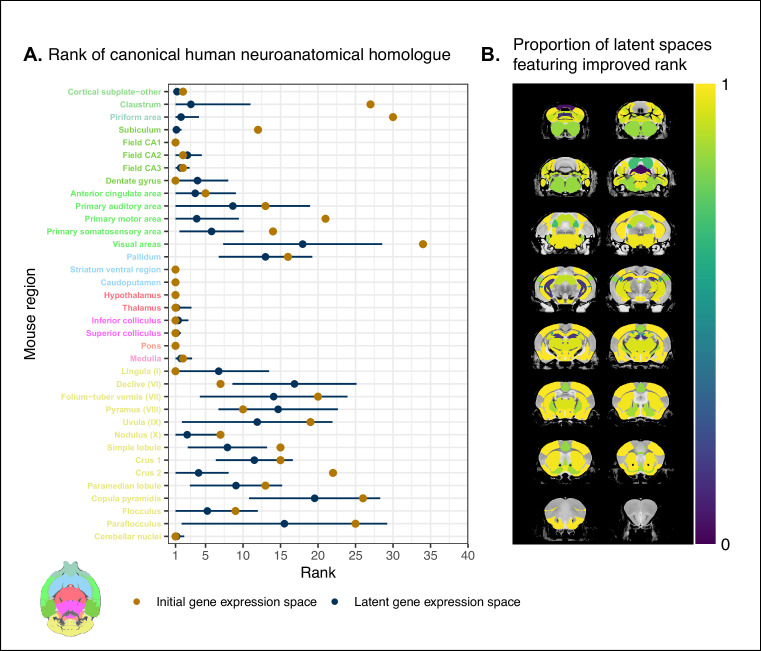
Figure 4. Recovering canonical neuroanatomical pairs in gene expression space.
(A) Comparison between the ranks of canonical human matches for mouse seed regions between the initial gene expression space and gene expression latent spaces. Points and error bars represent mean and 95% CI with n = 500. Mouse region names are colored according to the Allen Mouse Brain Atlas palette. Binomial likelihood estimate of p=0.64 with 95% CI [0.47, 0.78]. The probability of obtaining at least thse many successes under the null binomial distribution, , is p=0.033. (B) Proportion of latent spaces resulting in an improvement or null difference compared with the initial gene space, estimated using region-wise logistic regressions. Uncolored voxels correspond to regions with no established canonical human match.

