
Figure 4. Modeling barcoding mutagenesis and inferring time-scaled phylogenies from lineage barcodes using Phylotime.
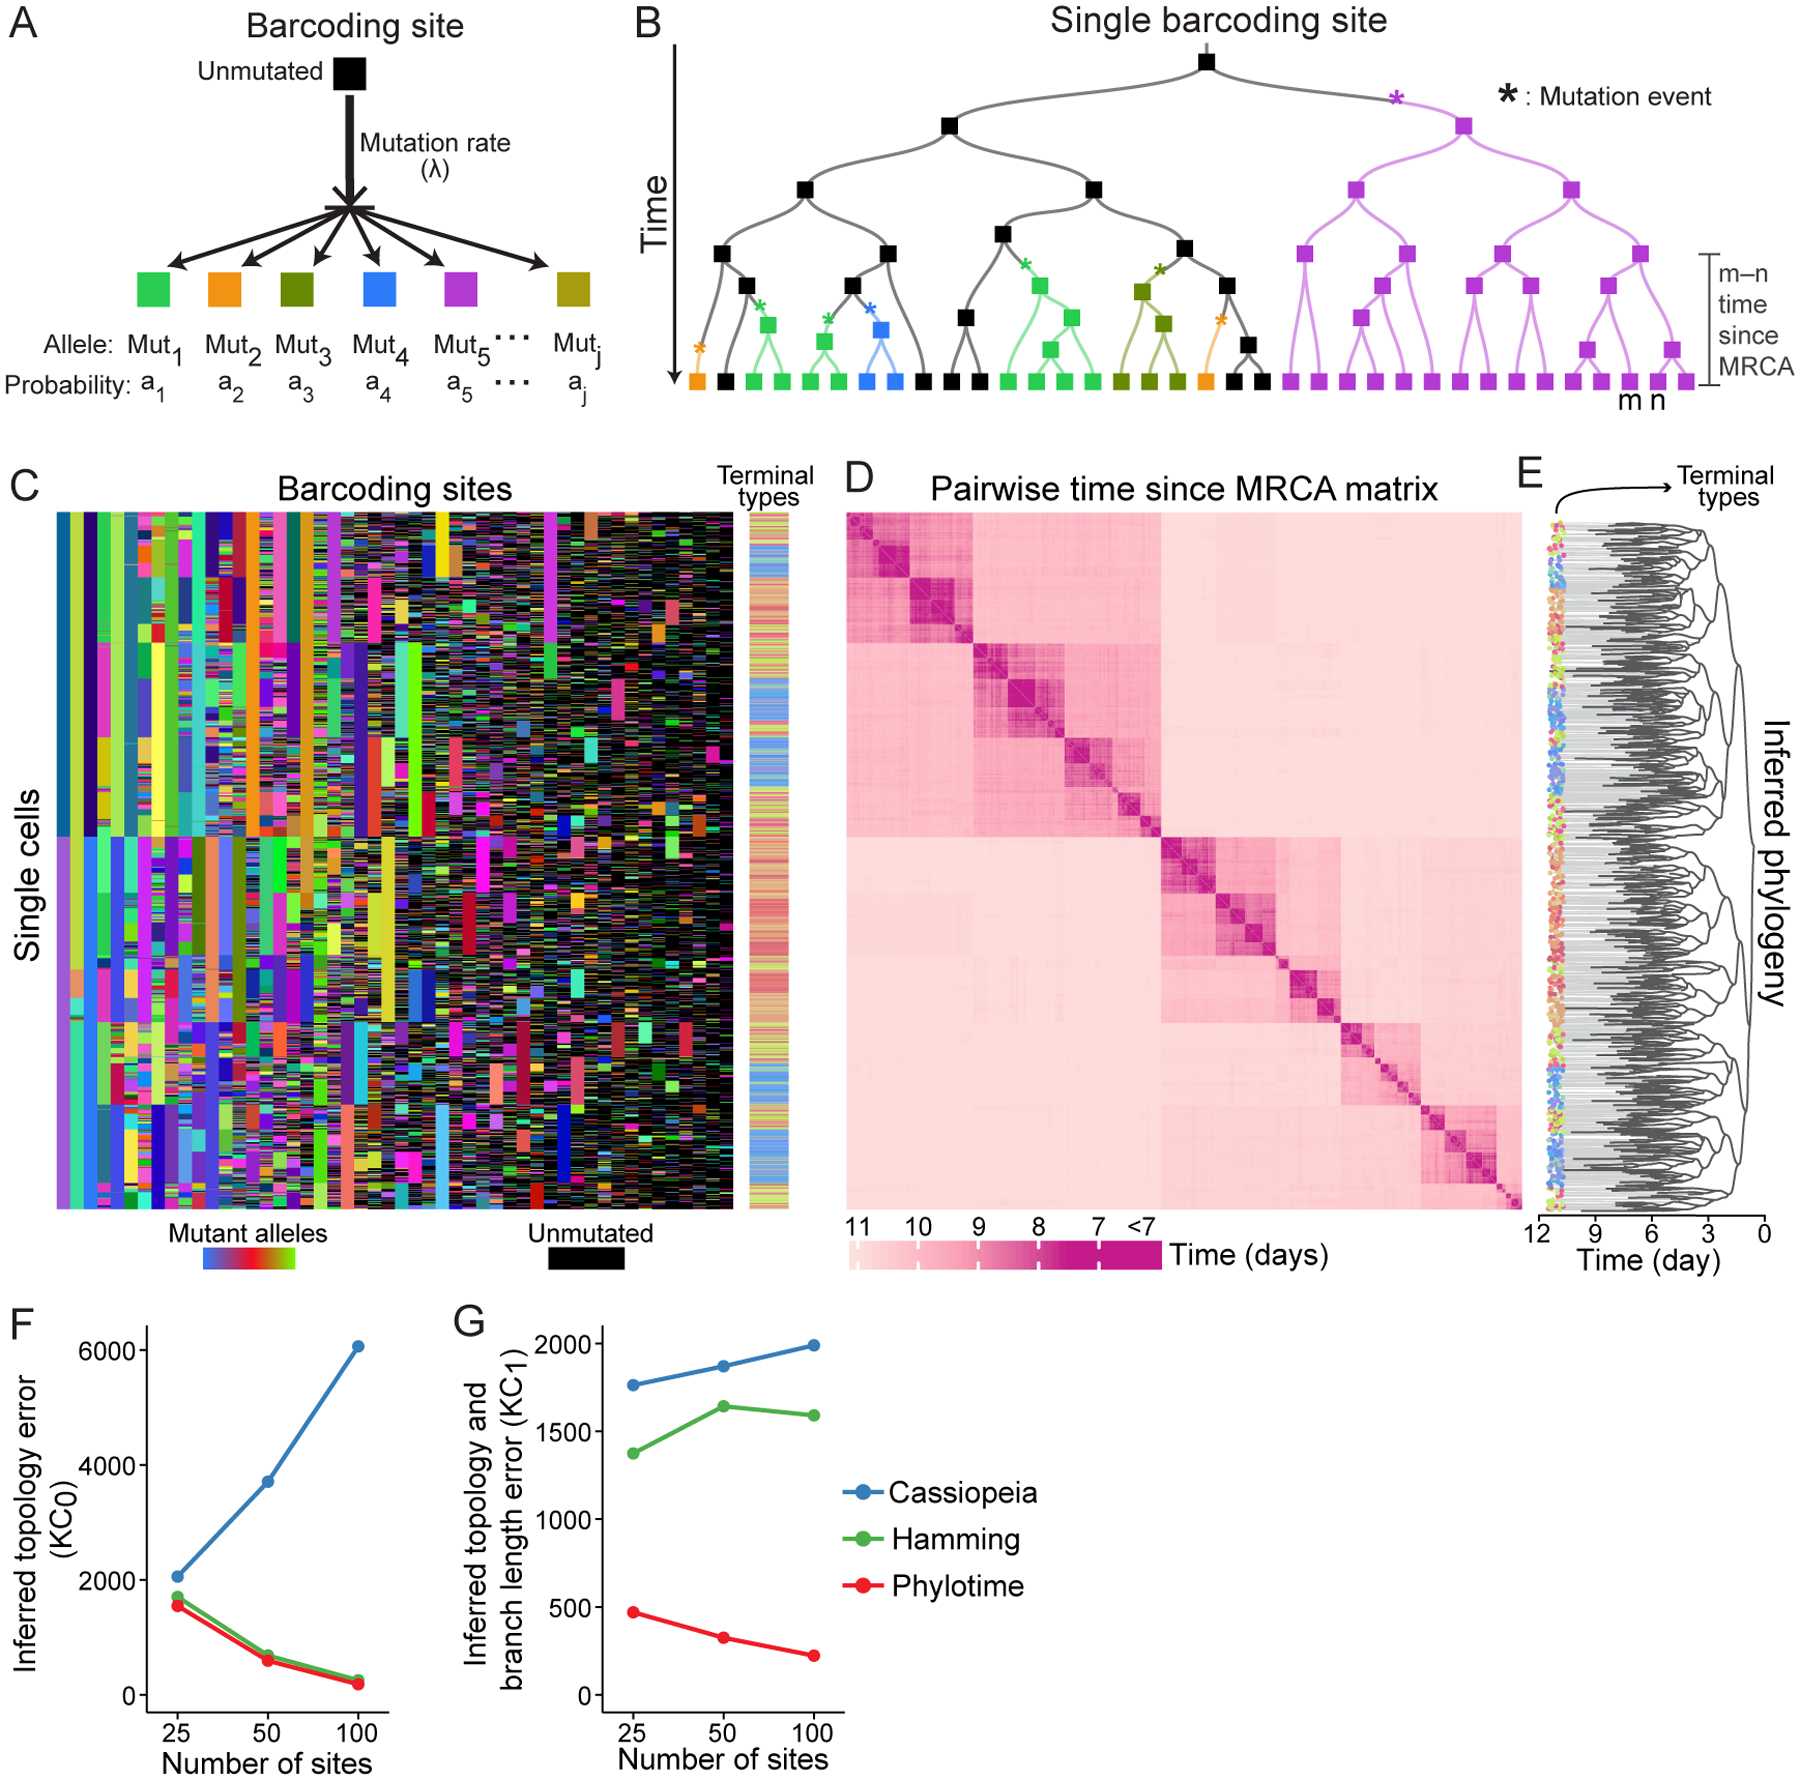
(A) Model of a barcoding site which mutates with a constant rate (λ) to convert to one of many possible mutant alleles (Mut1, …, Mutj), each with an emergence probability (a1, …, aj).
(B) Example time-scaled phylogeny showing the inheritance of a single barcoding site. Rectangles represent the site, their colors represent its allelic state according to A. Asterisks denote mutation events. Only the unmutated allele (black) can change, mutated alleles (colored) are inherited from a cell by all its descendants. The time since MRCA is shown for two terminal cells, m and n.
(C) Character matrix showing the output of a simulated barcoding experiment based on Figure 1A,B fate map with each barcoding site as a column and each cell as a row. Unmutated alleles are in black, mutant alleles in other colors. Color bar on the right shows cell types with Figure 1A as color key.
(D) Heatmap showing the estimated pairwise time since MRCA for all cells in C.
(E) Time-scaled phylogenetic tree inferred by applying Phylotime to D. Colors of terminal nodes signify cell type.
(F,G) Error of phylogenetic reconstruction using Phylotime (red), Hamming distance with UPGMA (green), and Cassiopeia (blue), with 25, 50, or 100 barcoding sites when considering only tree topology (F) or tree topology and branch length (G) across the panel of 530 simulated barcoding experiments with 16 terminal types (Mean ± SEM, N=530; SEM very small).
See also Figure S4.