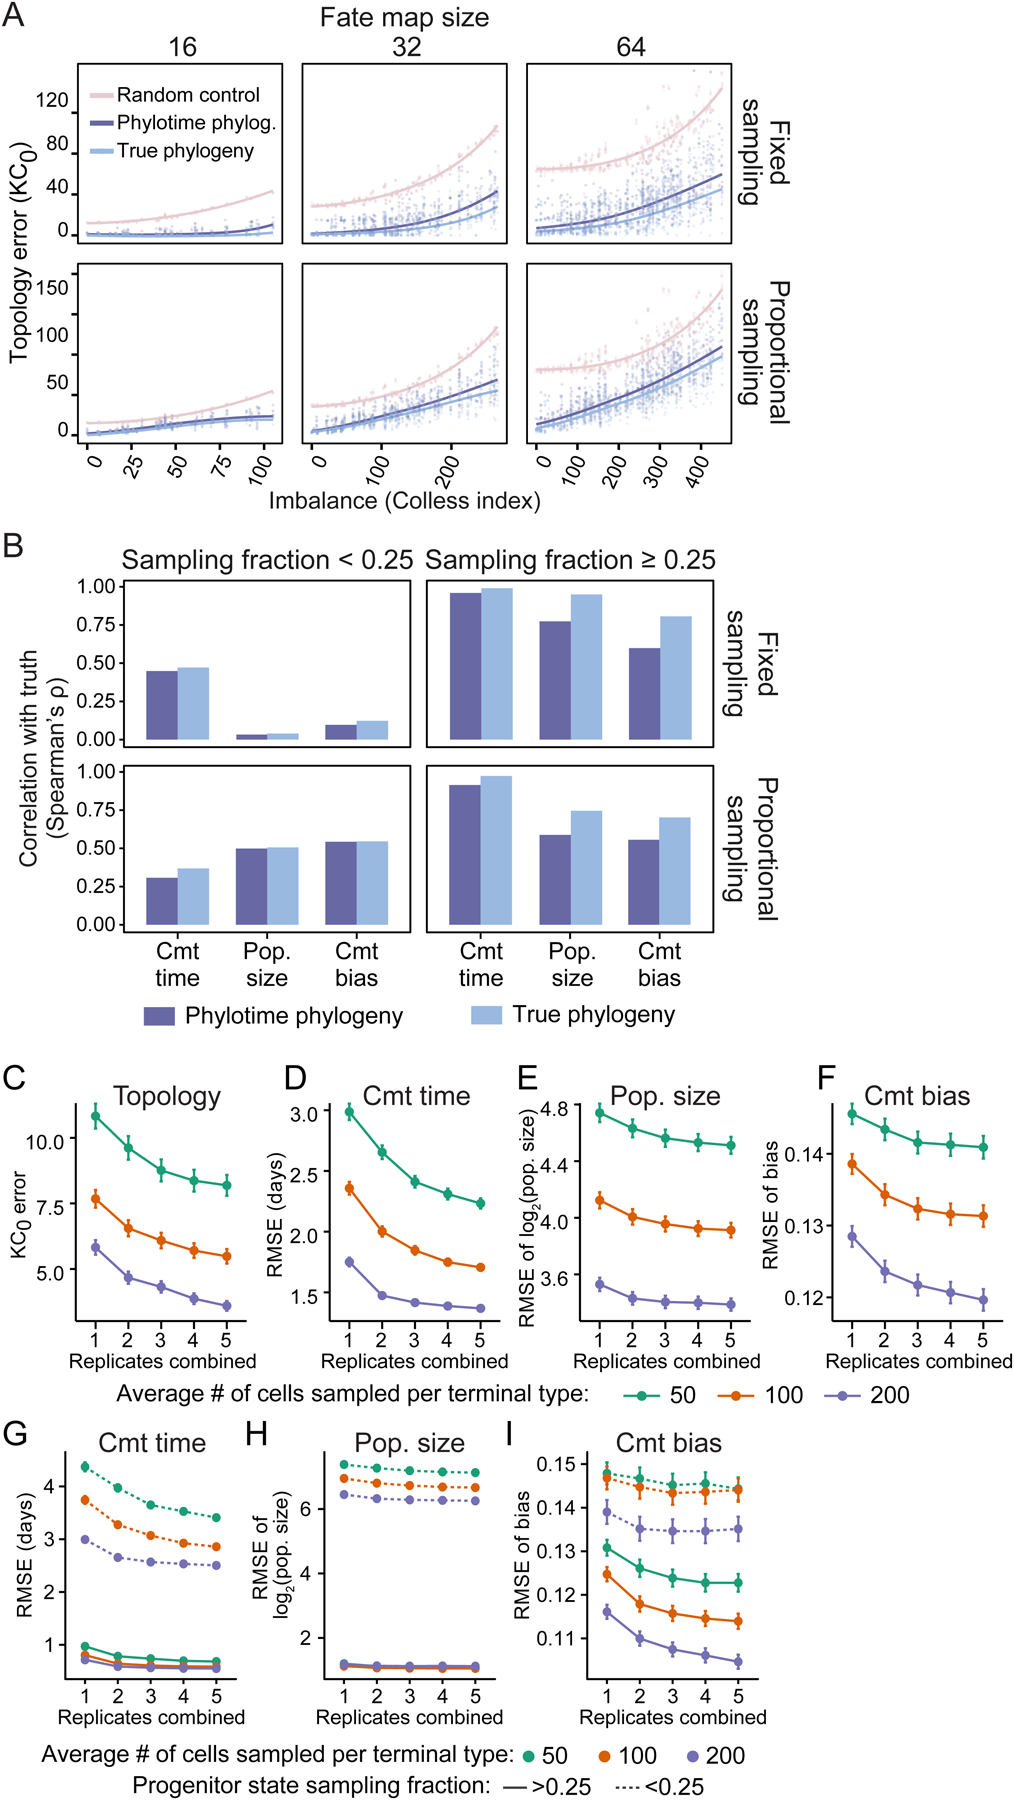
Figure 5. Quantitative fate map reconstruction from lineage barcodes using Phylotime and ICE-FASE.

(A) Scatter plots showing error of fate map topology reconstruction (KC0) after applying ICE-FASE algorithm to true (light blue) or Phylotime-inferred (dark blue) phylogeny as a function of map imbalance for all 3,310 simulated barcoding experiments faceted by fate map size (columns) and sampling strategy (rows). The faded pink points establish baseline error based on random topology reconstruction. Trendlines (LOESS) are shown.
(B) Barplots of Spearman’s correlation between true and estimated commitment (cmt) time, population (pop.) size, cmt bias for all progenitor states in 3,310 simulated experiments, faceted by sampling fraction (columns) and sampling strategy (rows). Values from true phylogenies are shown in light blue and those from Phylotime-inferred in dark blue.
(C–F) Lineplots showing the performance of quantitative fate map reconstruction as a function of the number of replicates combined when sampling 50 (green), 100 (orange), or 200 (purple) cells on average from each terminal type in the panel of 16-terminal type fate maps, measured by the error of topology (C), cmt time (D), pop. size (E), and cmt bias (F) estimates (Mean±SEM; N=106).
(G–I) Same as D–F but estimates separated for well-sampled (solid lines) and undersampled (dotted lines) progenitor states.
See also Figures S4, S5, and S6.
