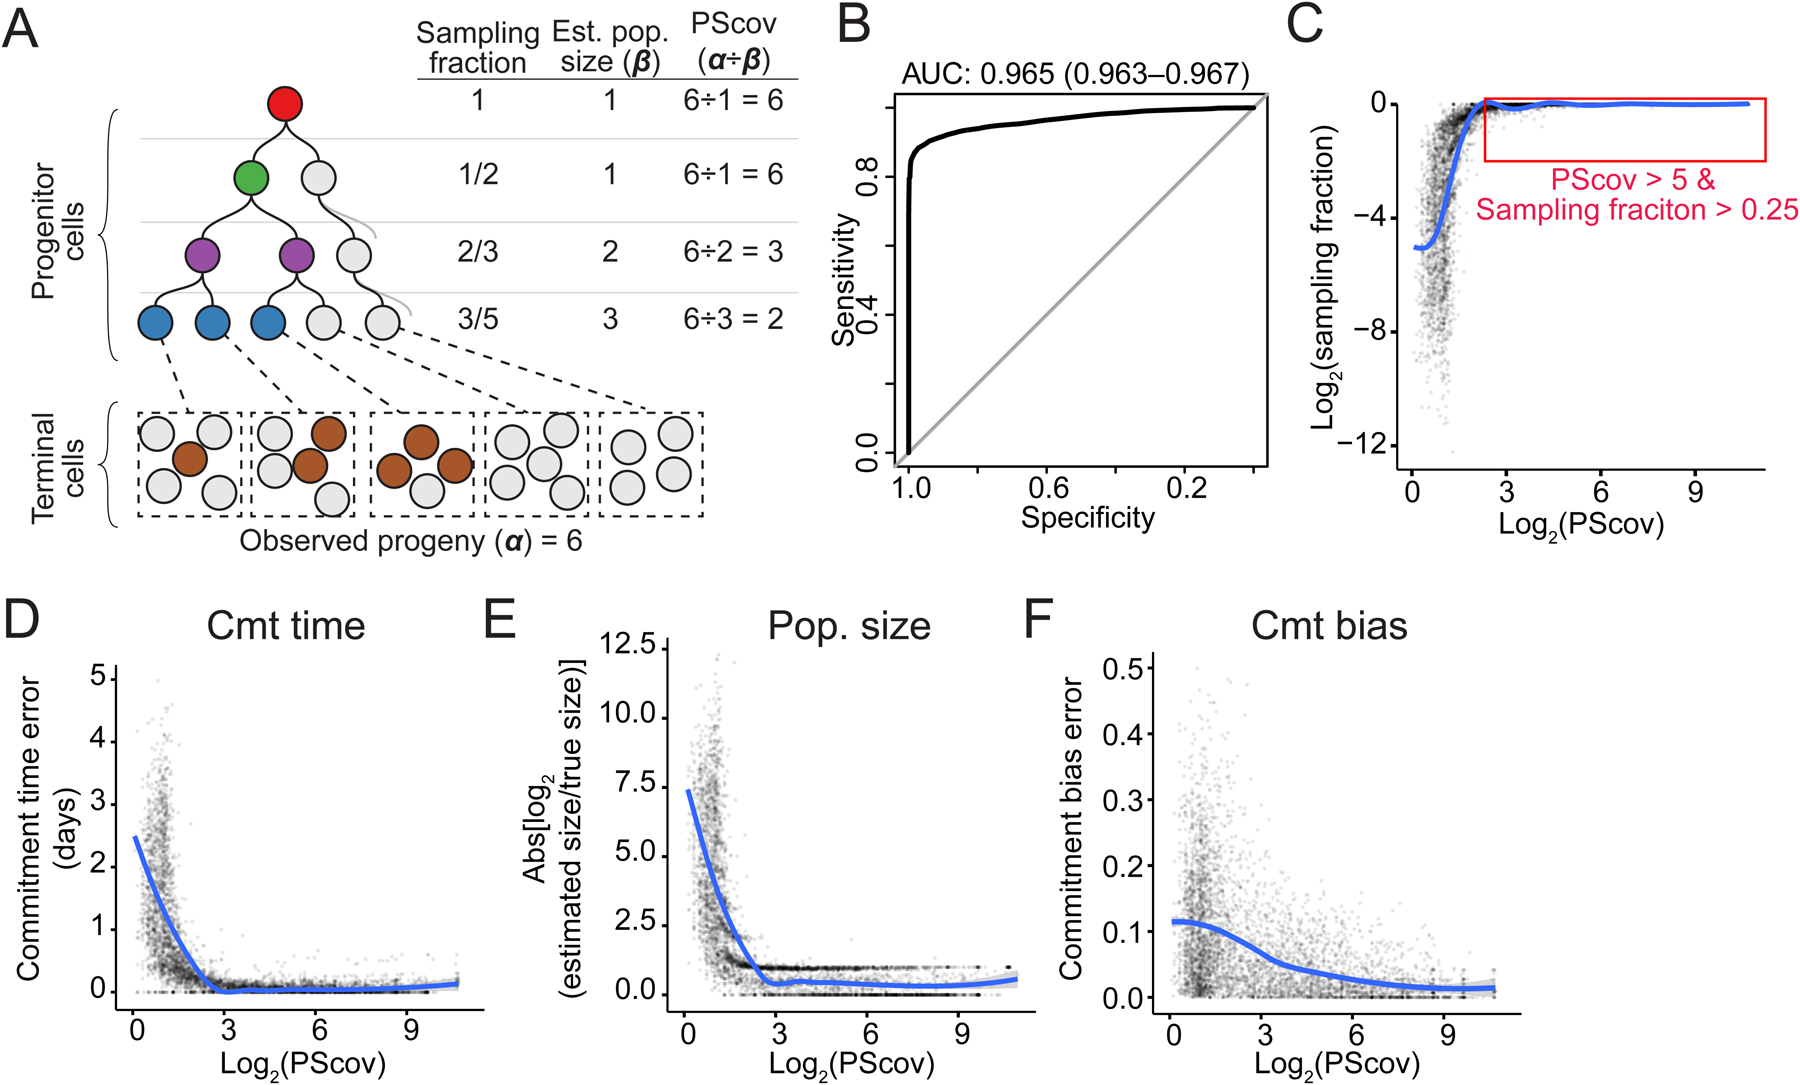
Figure 6. PScov measures robustness of reconstructed quantitative fate maps.

(A) Schematic showing how PScov is calculated. Each circle represents a cell, colors represent different progenitor states the cells have been assigned to, gray circles represent unsampled progenitor and terminal cells. Est: estimate; pop: population.
(B) Area Under the Receiver Operating Characteristics (auROC) curve for PScov shows a high sensitivity and specificity in detecting well-sampled progenitor states. CI: confidence interval.
(C) Scatter plot of progenitor state sampling fraction as a function of its PScov in 3,310 simulated experiments. Trendline (LOESS) shown in blue.
(D–E) Scatter plots showing the error of cmt time (D), pop. size (E), and cmt bias (F) estimates for progenitor states as a function of their PScov in our panel of 3,310 simulated experiments.
Trendline (LOESS) shown in blue.
