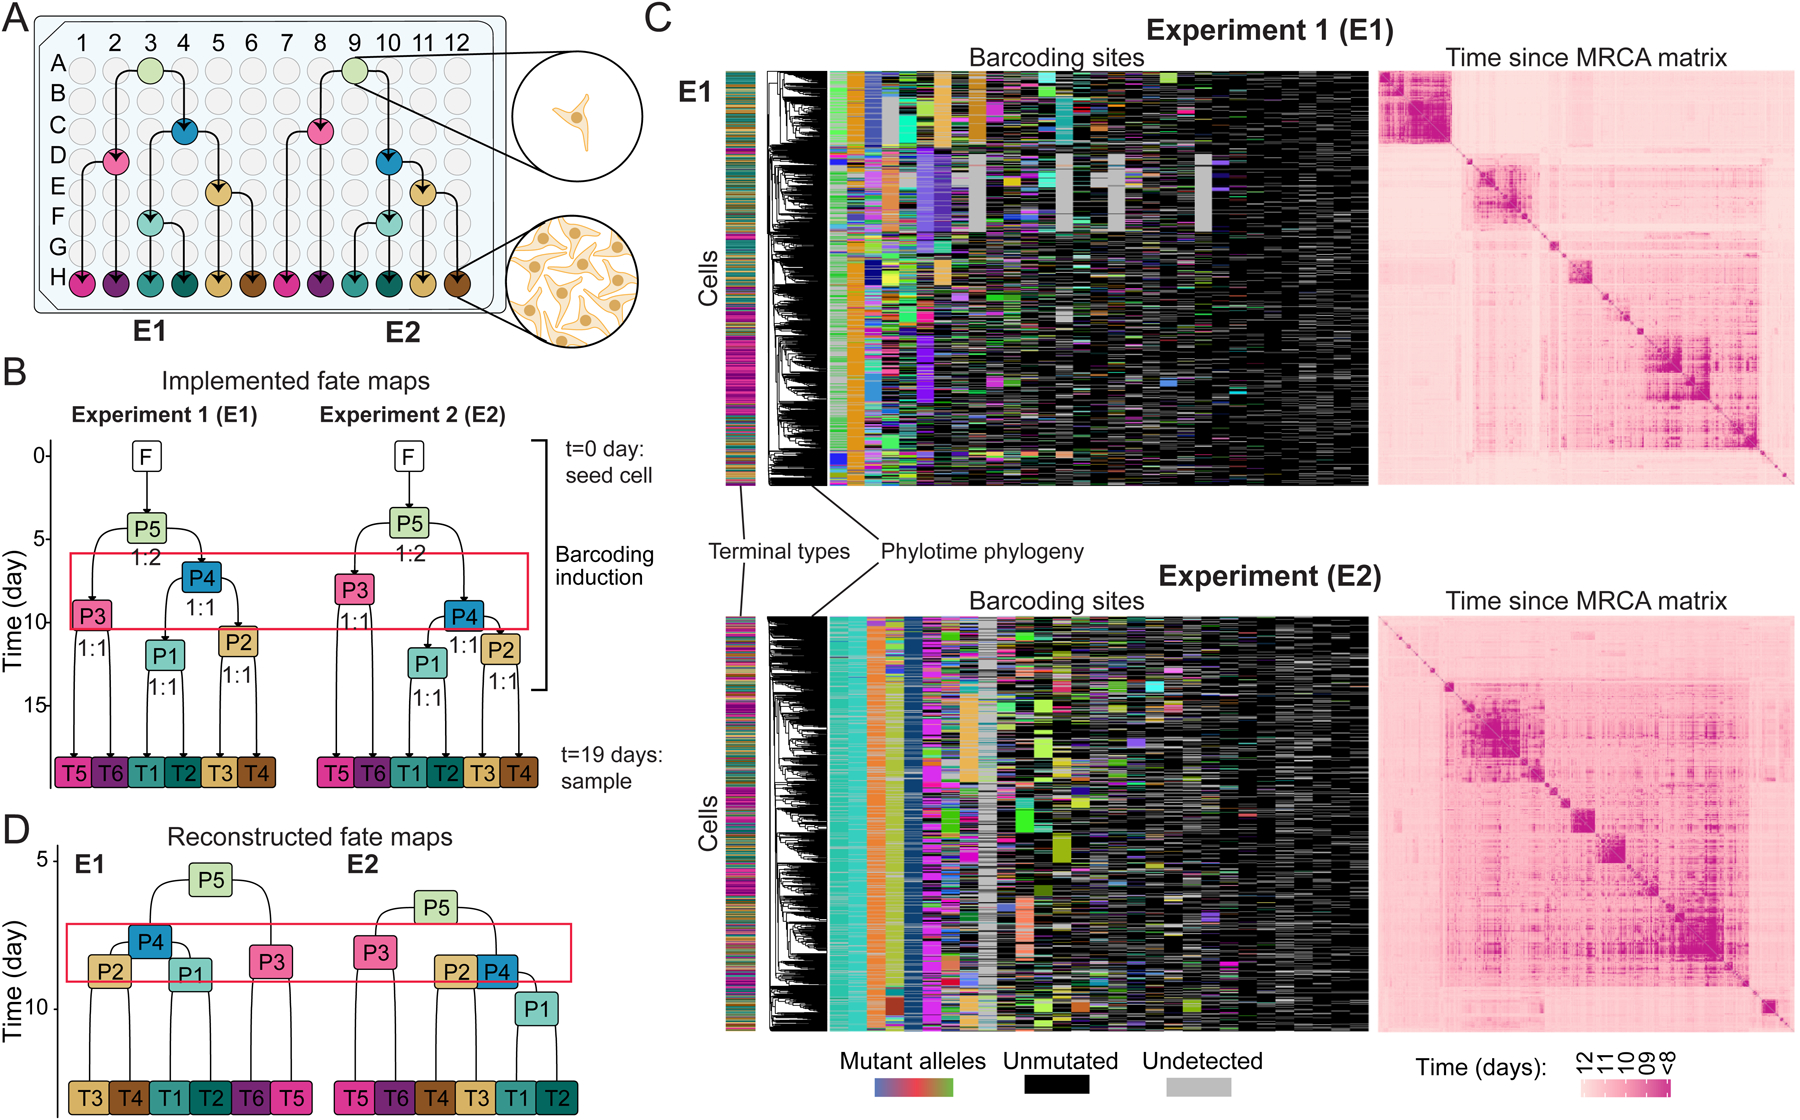
Figure 7. Validation of quantitative fate mapping using cell culture model system.

(A) Split–passage scheme in cultured iPSCs for E1 and E2 experiments. Arrows show passages.
(B) Quantitative fate maps implemented in E1 and E2 using scheme in A. Numbers under progenitor states mark split ratios (left:right); red box highlights the differences between progenitor state order. F: founder cell; P: progenitor states; T: terminal type.
(C) Character matrices of lineage barcodes (left) and heatmaps of pairwise time since MRCA matrix from hundreds of sequenced single cells in E1 (top) and E2 (bottom). Phylotime-inferred phylogeny is aligned to the matrix. Color bar on left marks the type of each cell according to B. Other plot features are the same as Figures 4C,D.
(D) Reconstructed quantitative fate maps for E1 (left) and E2 (right). The red box highlights the differences in progenitor state ordering. Labels same as B.
See also Figure S7.
