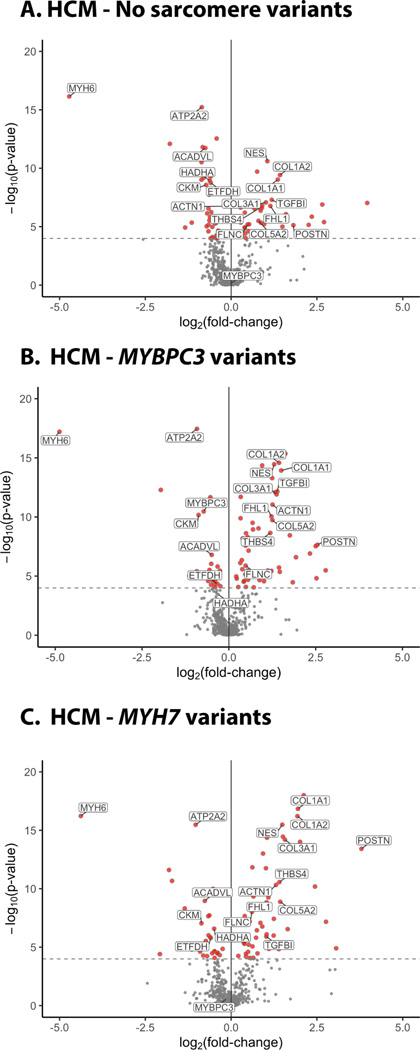
Figure 1. Volcano plots summarizing findings from proteomics analysis of human HCM and control hearts.
Proteins with increased (+ log) or decreased abundance (- log) are shown as a function of fold change over control hearts for HCM samples with (A) no sarcomere variants, (B) MYBPC3 variants, and (C) MYH7 variants. Proteins that were significantly different from control, after Bonferroni correction for multiple comparisons (P<0.0001), are shown in red and a subset of the individual proteins are labeled. N=6 controls, 18 HCM-MYBPC3, 9 HCM-MYH7, and 12 HCM - No sarcomere variant.

