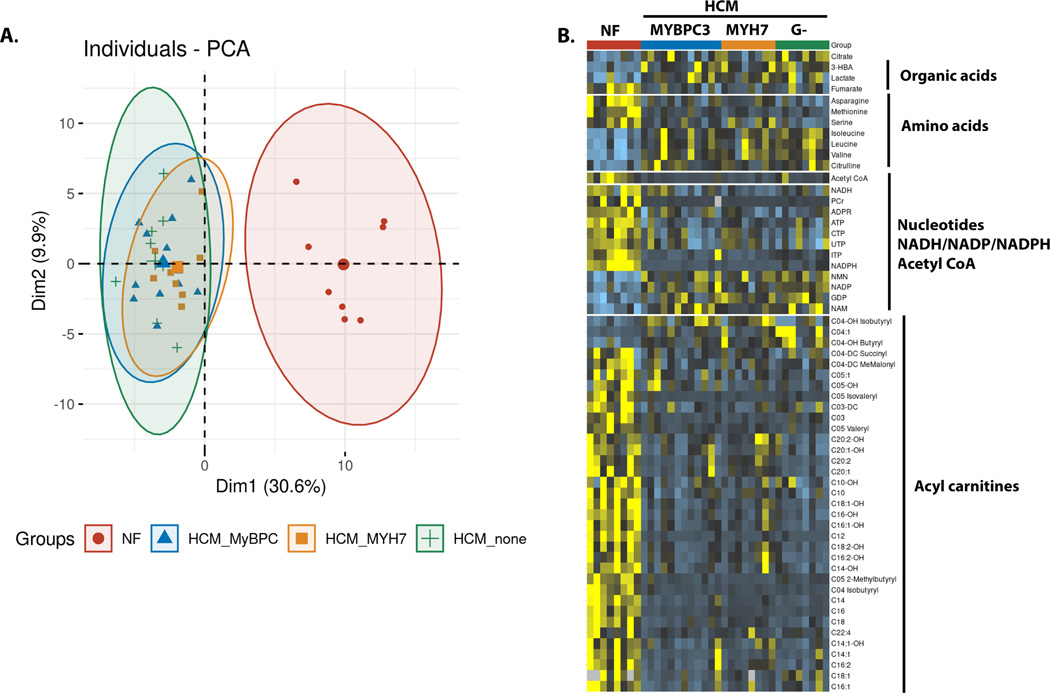
Figure 2. Metabolomic analysis of HCM and control hearts.
(A) PCA plot showing the overall distinction between the control hearts and the 3 HCM groups. The 3 HCM groups overlap with each other with more variability in the HCM – no sarcomere variant group. (B) Heat map showing the individual metabolites that were significantly different in the HCM compared to the control heart samples after adjustment by false discovery rate. N=8 for controls, HCM- MYH7, HCM-no sarcomere variant and N=12 for HCM-MYBCP3.

