FIGURE 2.

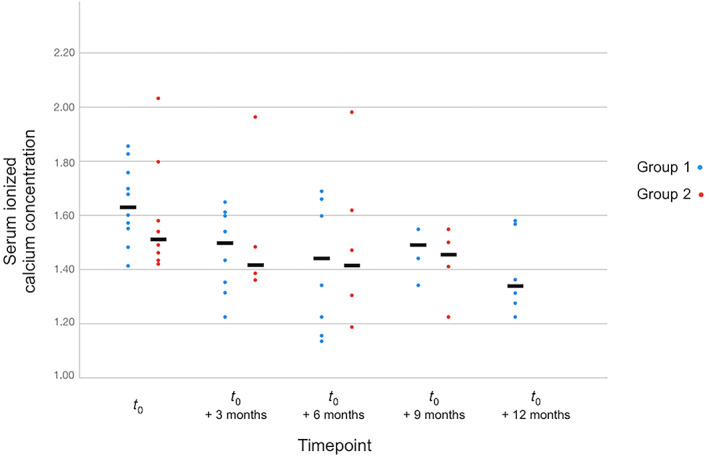
Scatter plot of serum ionized calcium concentration at each follow‐up timepoint (±2 months) between cats from Group 1 and Group 2

Scatter plot of serum ionized calcium concentration at each follow‐up timepoint (±2 months) between cats from Group 1 and Group 2