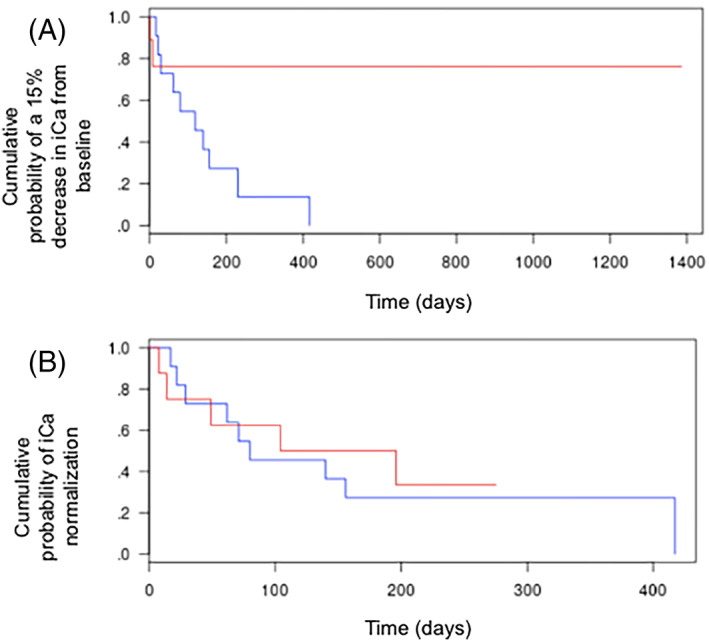
FIGURE 3.

Kaplan‐Meier estimates for the occurrence of a 15% decrease in ionized calcium concentration (iCa) from baseline (A) and occurrence of normocalcemia (B) between baseline and the last check‐up. The median time to a 15% decrease in iCa was significantly different in Group 1 compared with Group 2 (P = .02). No significant difference was noted when evaluating the time to occurrence of normocalcemia (P = .81). Blue curve: treatment with alendronate (Group 1); red curve: other or no treatment (Group 2)
