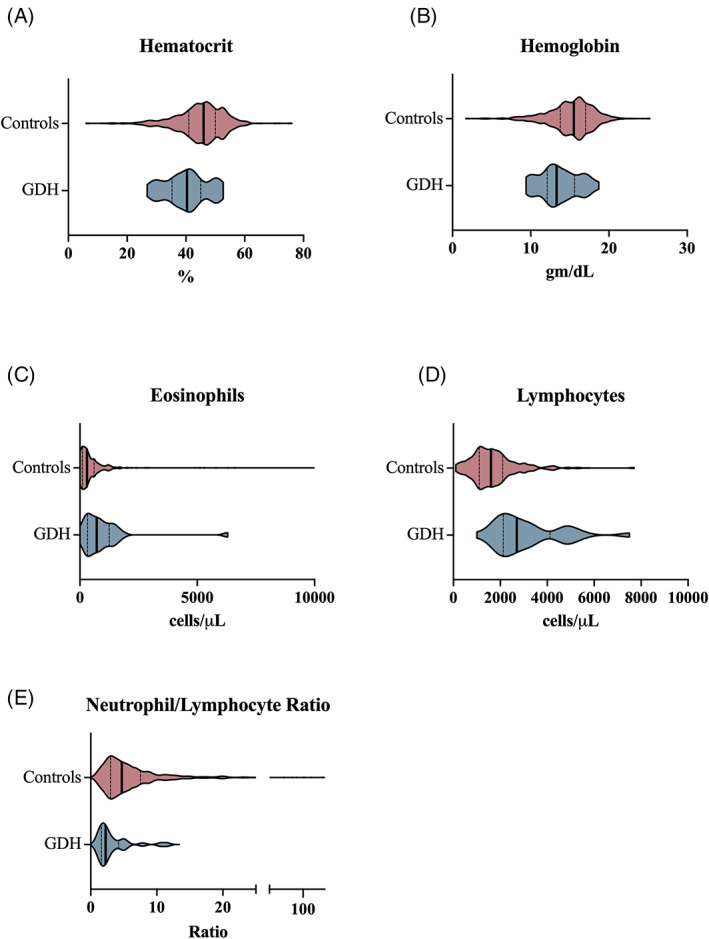
FIGURE 1.

Hematologic variables that differed between a cohort of dogs with GDH versus a cohort of control dogs. Violin plots compare hematologic variables (A, hematocrit; B, hemoglobin concentration; C, eosinophil count; D, lymphocyte count; E, neutrophil/lymphocyte ratio) for the control population (red) and GDH population (blue). The bold vertical line represents the population median and thin vertical lines represent the lower and upper quartiles
