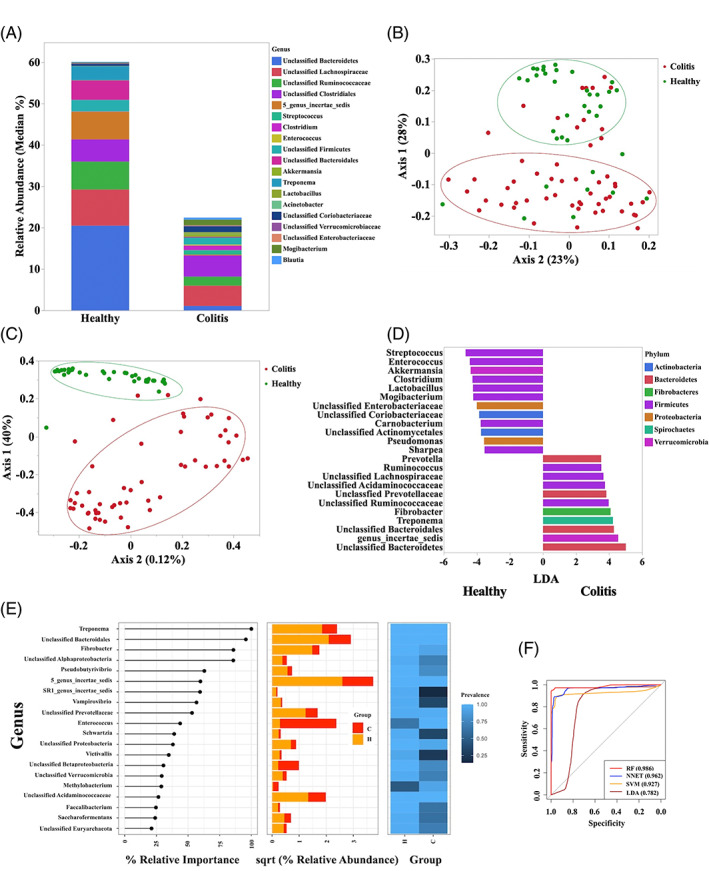
FIGURE 1.

(A) Relative abundance (median) of the more abundant genera identified in healthy horses (n = 36) and horses with colitis (n = 55). (B) Principal coordinate analysis (PCoA) based on Jaccard index analysis of the bacterial 16S rRNA gene sequence data for fecal samples collected from healthy horses (n = 36) and horses with colitis (n = 55). (C) Principal coordinates analysis (PCoA) based on Yue and Clayton index analysis of the bacterial 16S rRNA gene sequence data for fecal samples collected from healthy horses (n = 36) and horses with colitis (n = 55). (D) Plot from LEfSe analysis indicating enriched taxa in fecal samples of healthy horses (n = 36) and horses with colitis (n = 55). Linear discriminant analysis (LDA) cut off >3.5 and P < .05. (E) Plot from random forest analysis showing the relative importance, abundance, and prevalence of taxa differentiating the fecal microbiota of healthy horses and horses with colitis. (F) Area under the receiving operator curves of the random forest (RF), neural network (NNET), support vector machine (SVM), and linear discriminate analysis (LDA) for prediction of diseases state (healthy vs colitis) based on the fecal microbiota profile
