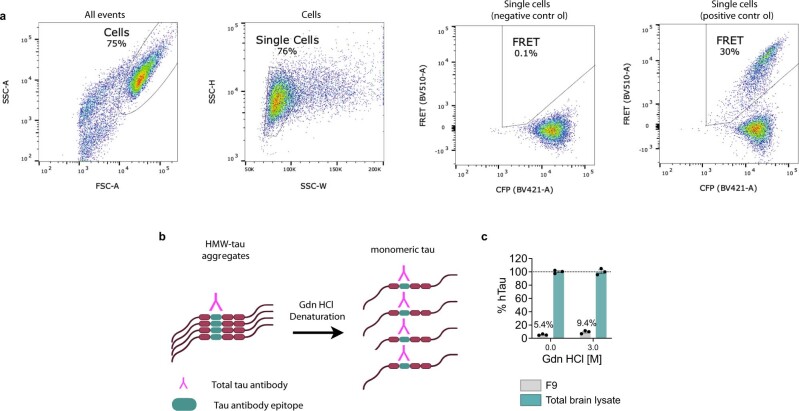
Extended Data Fig. 1. HMW tau seed represents a low percentage of total tau in the PS19 mouse brain.
a, Cells were gated on a FSC-A vs SSC-A plot. From the gated cells population, single cells were gated on a SSC-W vs SSC-H plot. From the gated single cells population, FRET positive cells were gated on a BV421-A vs BV510-A plot after compensation. The FRET-positive population lies in the region with the same BV421-A intensity, but higher BV510-A intensity, with the boundary between positive and negative determined by excluding the signal from a negative control. b, Schematic of aggregated tau denaturation by guanidine HCl (Gdn HCl). c, hTau present in F9 (gray bars) as a percentage of total brain lysates (green bars) before and after denaturation with 3 M of Gdn-HCl. Total human tau levels were assayed by ELISA. Data represent the mean ± s.e.m. The experiment was performed with n = 3.

