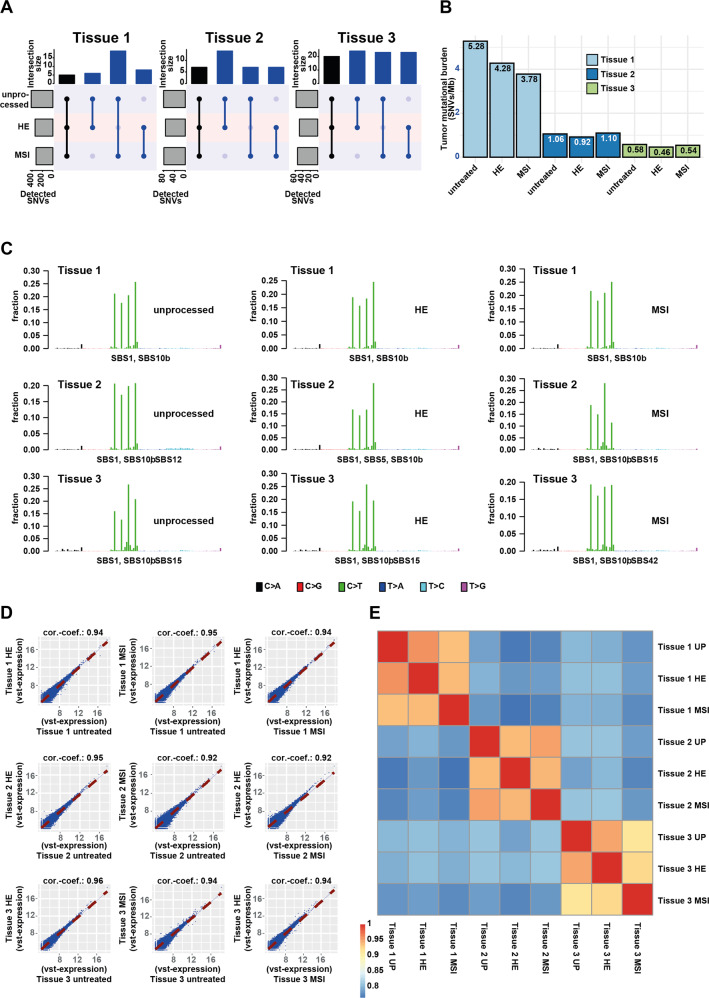
Fig. 3. Comparative analysis of WES and transcriptome profiles of FFPE, FFPE-HE, and FFPE-MSI analyzed tissues.
A Numbers of overlapping SNVs detected after differential processing in the three tissues. B Bar plots of the tumor mutational burdens detected in all samples. C Top 30 frequent SNVs and affected genes per tissue and sample. D, E Pairwise correlations between gene expression profiles of all combinations of processing steps for the three tissues analyzed visualized as scatter plots (D) and a correlation heatmap (E).

