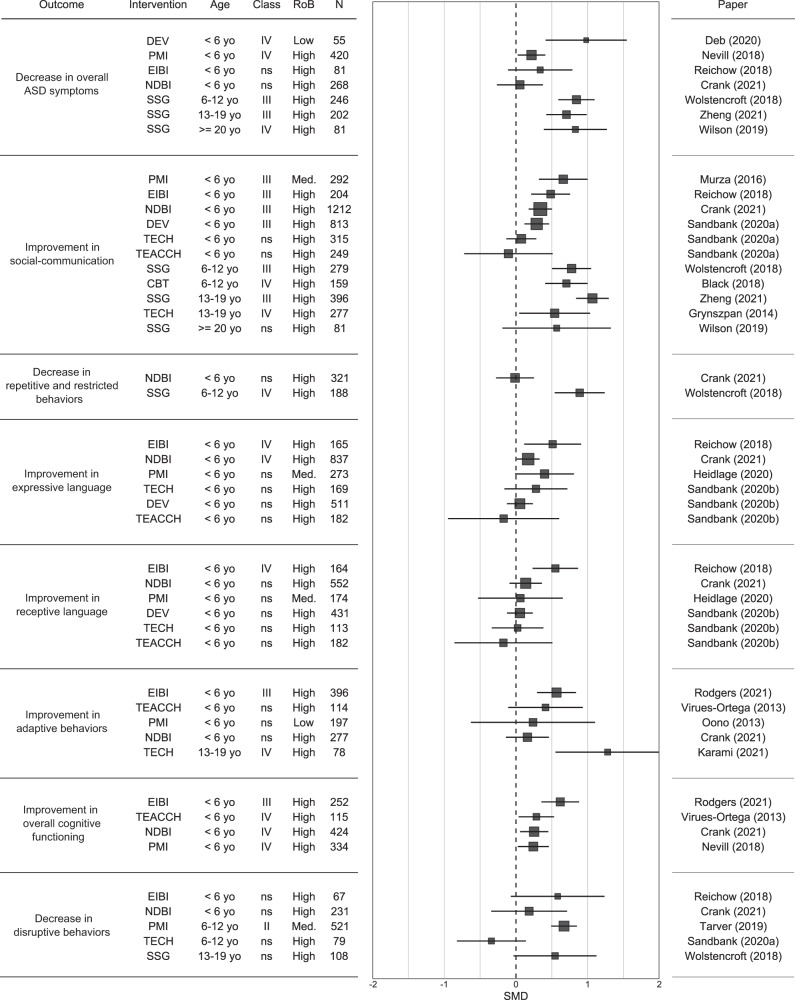
Fig. 2. Forest plot of the pooled effect size for each intervention type and outcome we considered in the umbrella review.
Some characteristics of the meta-analyses are displayed: mean age (yo = years old), class, sample size (N), and risk of bias (RoB; Low = more than 75% of the participants were in studies at low risk of bias; Med. = 50% to 75% of participants were in studies a low risk of bias; High = less than 50% of participants were in studies at low risk of bias).

