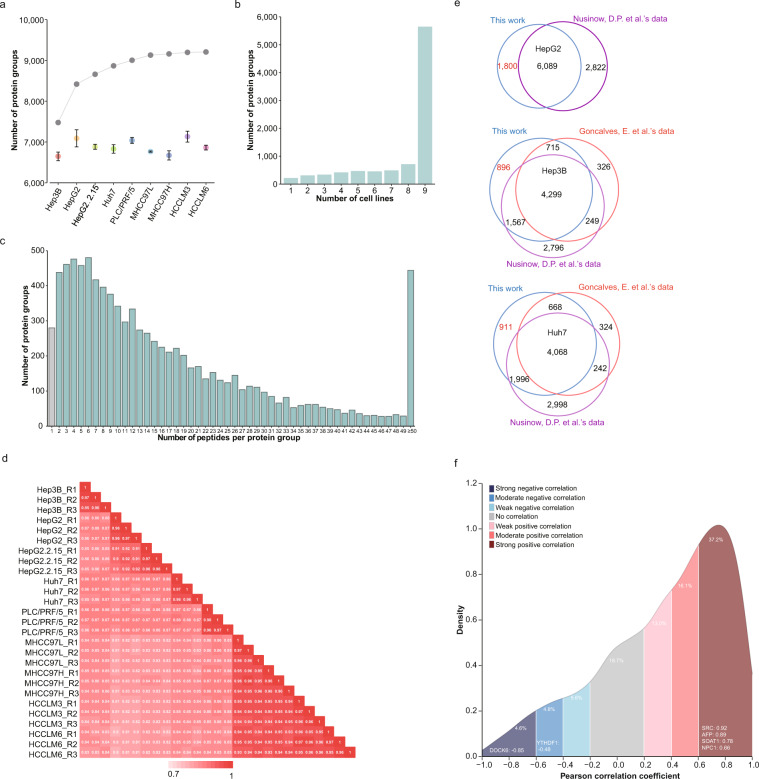
Fig. 2.
Proteome profiling of HCC cell lines. (a) The identified protein group number of nine HCC cell lines. The cumulative curve was shown on the top in gray. (b) Bar plot showed the number of protein groups detected in different number of HCC cell lines. (c) Bar plot showed the number of protein groups having different number of peptides. (d) Heatmap showed the Pearson correlation coefficients of nine HCC cell lines. (e) Venn diagrams shows the uniquely identified protein groups in this study compared with data reported by Nusinow, D.P. et al.7 and Gonçalves, E. et al.8. (f) Density plot shows the proteome-transcriptome correlation distribution of protein groups by five HCC cell lines. Different Pearson correlation coefficient ranges are represented by different colours. Representative proteins are marked in the figure.

