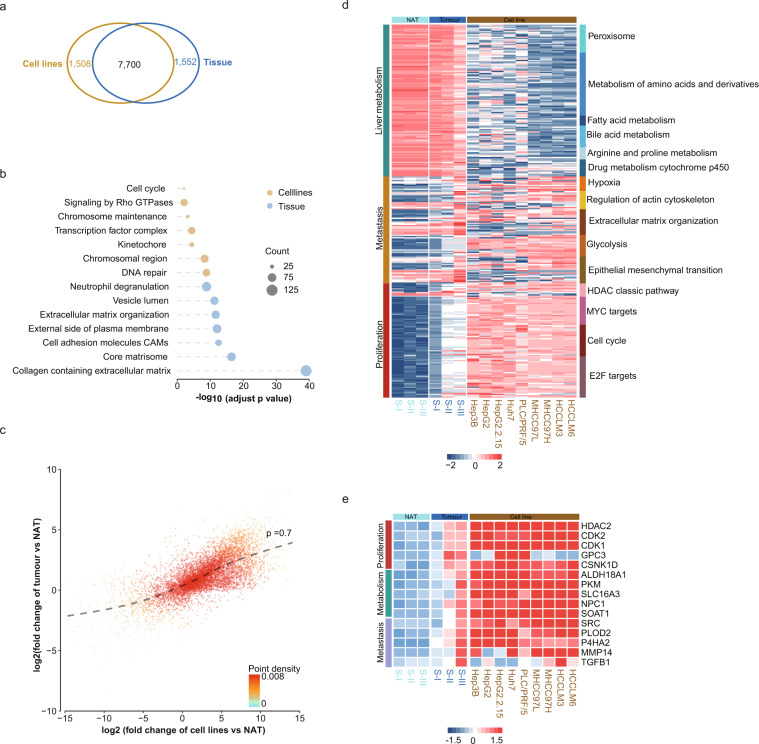
Fig. 4.
Molecular characteristics of HCC cell lines relative to tumour and NAT. (a) Venn diagram shows number of protein groups identified only in cell lines (orange), only in tissue (blue) and both in cell lines and tissue (black). (b) Go enrichment of proteins identified only in cell lines (orange), or only in tissue (blue). (c) The consistency between log2 transformed fold change between tumour tissue versus NAT and cell lines versus NAT. (d) Heatmap shows the normalized abundance of proteins in representative cancer-related pathways. (e) The protein abundance of drug targets expressed in both tissue and HCC cell lines.

