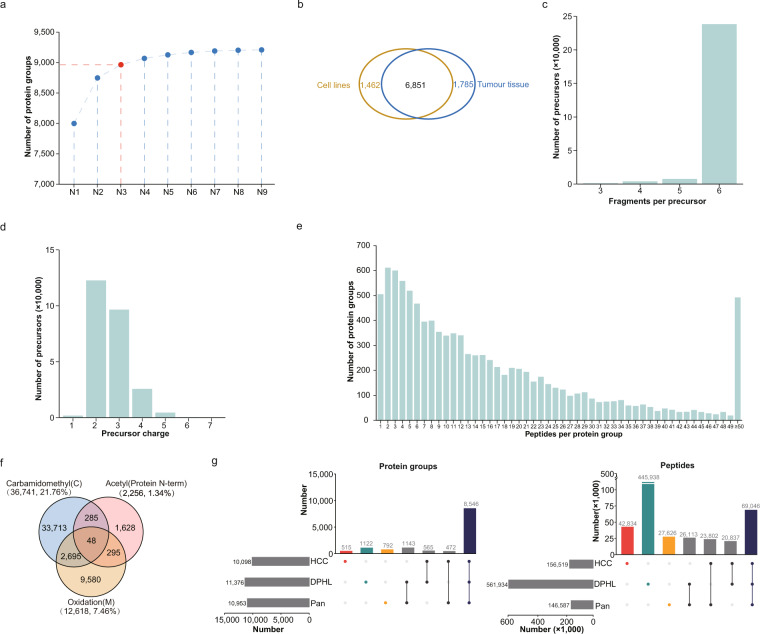
Fig. 5.
Overview of the HCC spectral library. (a) The max identified number of protein groups of different combinations of HCC cell lines. From N1 to N9 means the combinations of different number (from one to nine) of cell lines. Combining of the identified protein number of three cell lines HCCLM3, HepG2 and PLC/PRF/5 could cover 97% (8,964 of 9,208) of the protein groups identified in nine HCC cell lines, and this combine was coloured by red in the picture. (b) Number of protein groups in the HCC spectral library identified from HCC cell lines (orange) or tumour tissue (blue). (c) Bar plot showed the number of precursors by the number of fragments per precursor. (d) Bar plot showed the number of precursors by the charge states of precursor. (e) Bar plot showed the number of protein groups by the number of peptides per protein group. (f) Venn diagram shows number of peptides with different modifications. (g) Comparison the covered protein groups and peptides of the HCC spectral library with Pan Human library42 and DPHL library43. Protein groups and peptides uniquely covered in the HCC spectral library was coloured by red.

